请我喝杯咖啡☕
*我的帖子解释了移动 mnist。
movingmnist() 可以使用 moving mnist 数据集,如下所示:
*备忘录:
- 第一个参数是 root(必需类型:str 或 pathlib.path)。 *绝对或相对路径都是可能的。
- 第二个参数是 split(optional-default:none-type:str):
*备注:
- 没有,可以设置“train”或“test”。
- 如果为 none,则返回每个视频的所有 20 帧(图像),忽略 split_ratio。
- 第三个参数是 split_ratio(optional-default:10-type:int):
*备注:
- 如果 split 为“train”,则返回 data[:, :split_ratio]。
- 如果 split 为“test”,则返回 data[:, split_ratio:]。
- 如果 split 为 none,则忽略它。 忽略 split_ratio。
- 第四个参数是transform(optional-default:none-type:callable)。
- 第五个参数是 download(optional-default:false-type:bool):
*备注:
- 如果为 true,则数据集将从互联网下载到 root。
- 如果为 true 并且数据集已下载,则将其提取。
- 如果为 true 并且数据集已下载,则不会发生任何事情。
- 如果数据集已经下载,则应该为 false,因为它速度更快。
- 您可以从此处手动下载并提取数据集,例如数据/移动mnist/。
from torchvision.datasets import movingmnist
all_data = movingmnist(
root="data"
)
all_data = movingmnist(
root="data",
split=none,
split_ratio=10,
download=false,
transform=none
)
train_data = movingmnist(
root="data",
split="train"
)
test_data = movingmnist(
root="data",
split="test"
)
len(all_data), len(train_data), len(test_data)
# (10000, 10000, 10000)
len(all_data[0]), len(train_data[0]), len(test_data[0])
# (20, 10, 10)
all_data
# dataset movingmnist
# number of datapoints: 10000
# root location: data
all_data.root
# 'data'
print(all_data.split)
# none
all_data.split_ratio
# 10
all_data.download
#
print(all_data.transform)
# none
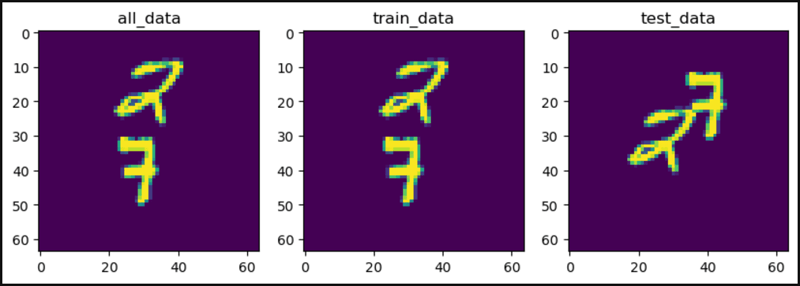
from torchvision.datasets import movingmnist
import matplotlib.pyplot as plt
plt.figure(figsize=(10, 3))
plt.subplot(1, 3, 1)
plt.title("all_data")
plt.imshow(all_data[0].squeeze()[0])
plt.subplot(1, 3, 2)
plt.title("train_data")
plt.imshow(train_data[0].squeeze()[0])
plt.subplot(1, 3, 3)
plt.title("test_data")
plt.imshow(test_data[0].squeeze()[0])
plt.show()
from torchvision.datasets import movingmnist
all_data = movingmnist(
root="data",
split=none
)
train_data = movingmnist(
root="data",
split="train"
)
test_data = movingmnist(
root="data",
split="test"
)
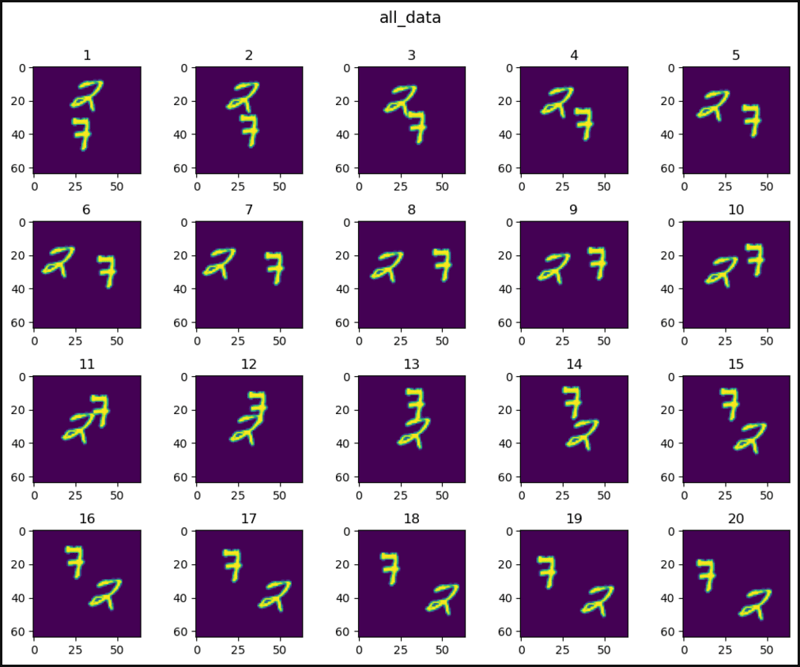
def show_images(data, main_title=none):
plt.figure(figsize=(10, 8))
plt.suptitle(t=main_title, y=1.0, fontsize=14)
for i, image in enumerate(data, start=1):
plt.subplot(4, 5, i)
plt.tight_layout(pad=1.0)
plt.title(i)
plt.imshow(image)
plt.show()
show_images(data=all_data[0].squeeze(), main_title="all_data")
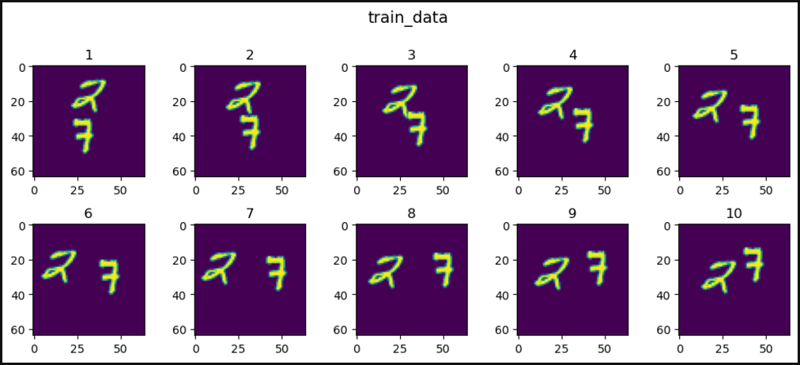
show_images(data=train_data[0].squeeze(), main_title="train_data")
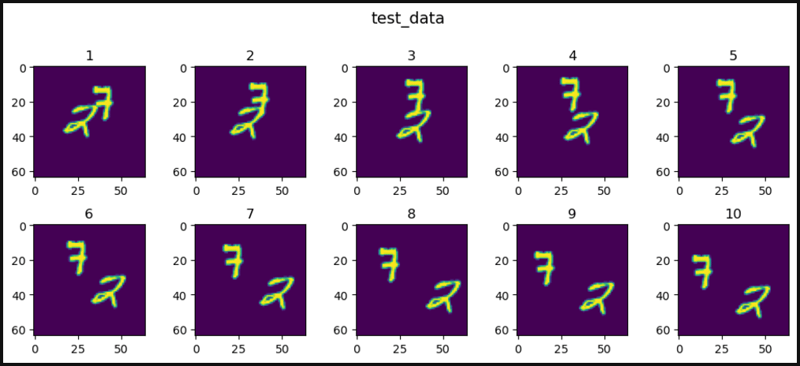
show_images(data=test_data[0].squeeze(), main_title="test_data")

from torchvision.datasets import movingmnist
all_data = movingmnist(
root="data",
split=none
)
train_data = movingmnist(
root="data",
split="train"
)
test_data = movingmnist(
root="data",
split="test"
)
import matplotlib.pyplot as plt
def show_images(data, main_title=none):
plt.figure(figsize=(10, 8))
plt.suptitle(t=main_title, y=1.0, fontsize=14)
col = 5
for i, image in enumerate(data, start=1):
plt.subplot(4, 5, i)
plt.tight_layout(pad=1.0)
plt.title(i)
plt.imshow(image.squeeze()[0])
if i == col:
break
plt.show()
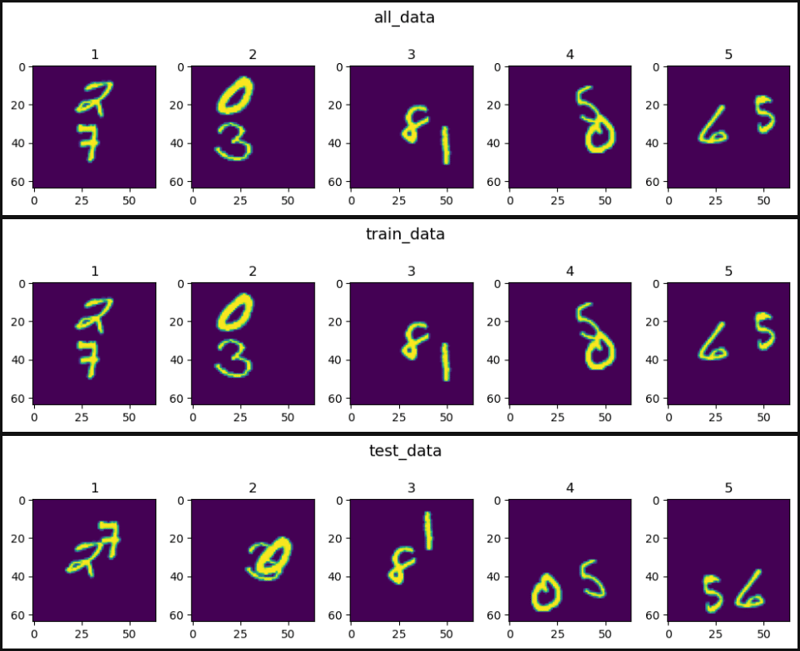
show_images(data=all_data, main_title="all_data")
show_images(data=train_data, main_title="train_data")
show_images(data=test_data, main_title="test_data")
from torchvision.datasets import movingmnist
import matplotlib.animation as animation
all_data = movingmnist(
root="data"
)
import matplotlib.pyplot as plt
from ipython.display import html
figure, axis = plt.subplots()
# ↓ ↓ ↓ ↓ ↓ ↓ ↓ ↓ ↓ ↓ `artistanimation()` ↓ ↓ ↓ ↓ ↓ ↓ ↓ ↓ ↓ ↓
images = []
for image in all_data[0].squeeze():
images.append([axis.imshow(image)])
ani = animation.artistanimation(fig=figure, artists=images,
interval=100)
# ↑ ↑ ↑ ↑ ↑ ↑ ↑ ↑ ↑ ↑ `artistanimation()` ↑ ↑ ↑ ↑ ↑ ↑ ↑ ↑ ↑ ↑
# ↓ ↓ ↓ ↓ ↓ ↓ ↓ ↓ ↓ `funcanimation()` ↓ ↓ ↓ ↓ ↓ ↓ ↓ ↓ ↓
# def animate(i):
# axis.imshow(all_data[0].squeeze()[i])
#
# ani = animation.funcanimation(fig=figure, func=animate,
# frames=20, interval=100)
# ↑ ↑ ↑ ↑ ↑ ↑ ↑ ↑ ↑ `funcanimation()` ↑ ↑ ↑ ↑ ↑ ↑ ↑ ↑ ↑
# ani.save('result.gif') # save the animation as a `.gif` file
plt.ioff() # hide a useless image
# ↓ ↓ ↓ ↓ ↓ ↓ ↓ ↓ show animation ↓ ↓ ↓ ↓ ↓ ↓ ↓ ↓
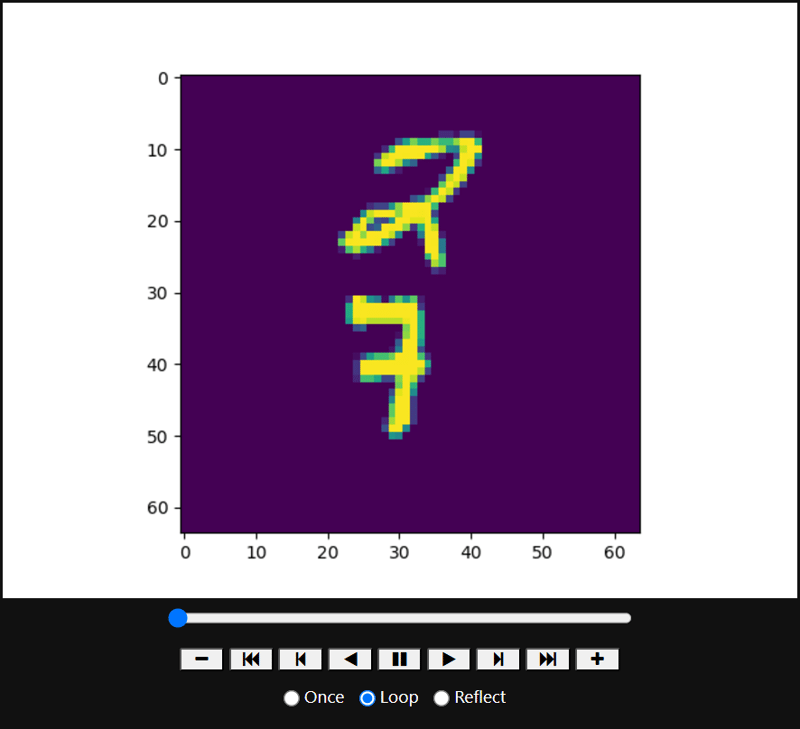
html(ani.to_jshtml()) # animation operator
# html(ani.to_html5_video()) # animation video
# ↑ ↑ ↑ ↑ ↑ ↑ ↑ ↑ show animation ↑ ↑ ↑ ↑ ↑ ↑ ↑ ↑
# ↓ ↓ ↓ ↓ ↓ ↓ ↓ ↓ ↓ ↓ ↓ ↓ show animation ↓ ↓ ↓ ↓ ↓ ↓ ↓ ↓ ↓ ↓ ↓ ↓
# plt.rcparams["animation.html"] = "jshtml" # animation operator
# plt.rcparams["animation.html"] = "html5" # animation video
# ↑ ↑ ↑ ↑ ↑ ↑ ↑ ↑ ↑ ↑ ↑ ↑ show animation ↑ ↑ ↑ ↑ ↑ ↑ ↑ ↑ ↑ ↑ ↑ ↑
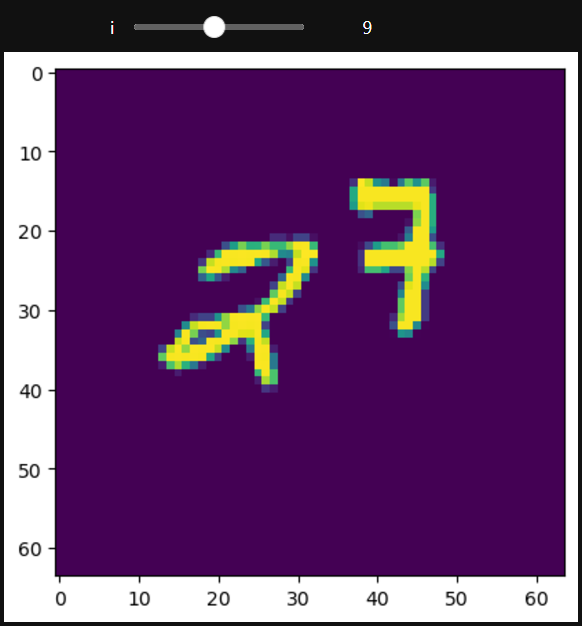
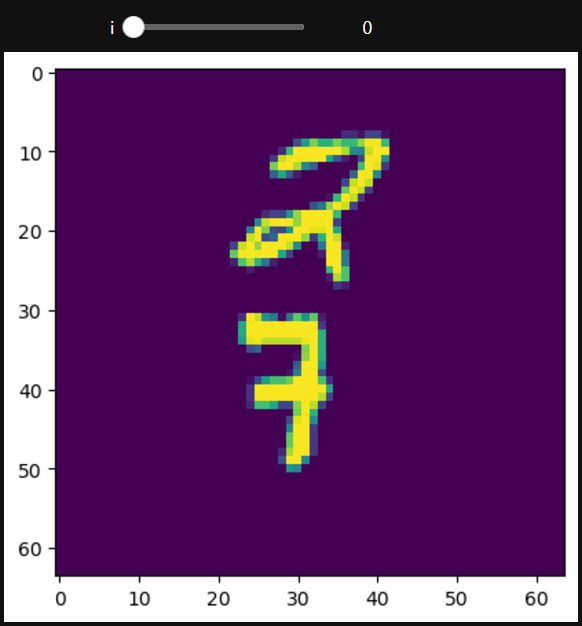
from torchvision.datasets import MovingMNIST
from ipywidgets import interact, IntSlider

all_data = MovingMNIST(
    root="data"
)

import matplotlib.pyplot as plt
from IPython.display import HTML

def func(i):
    plt.imshow(all_data[0].squeeze()[i])

interact(func, i=(0, 19, 1))
# interact(func, i=IntSlider(min=0, max=19, step=1, value=0))
# ↑ ↑ ↑ ↑ ↑ ↑ ↑ ↑ ↑ ↑ Set the start value ↑ ↑ ↑ ↑ ↑ ↑ ↑ ↑ ↑ ↑
plt.show()