
上篇文章我们简要解析了用户cpu时间相关概念及应用实践,具体可参考链接?:
Linux系统之User CPU time解析。
回顾之前的内容:在Linux操作系统中,通常采用8个不同的指标来研究Linux / Unix操作系统中的CPU消耗:用户CPU时间(us)、系统CPU时间(sy)、良好的CPU时间(ni)、空闲CPU时间(id)、等待CPU时间(wa)、硬件中断CPU时间(hi),软件中断CPU时间(si),被盗CPU时间(st)。在本文中,我们主要针对“等待CPU时间”进行解析。
什么是“等待” CPU时间?
等待CPU时间表示CPU等待磁盘I / O或网络I / O操作完成所花费的时间。等待时间过长表示由于该设备上的I / O操作,CPU被“绞死”了。为了获得最佳性能,应该以使I / O等待CPU时间尽可能短为目标。如果等待时间> 10%,则需要对其进行问题排查。

我们可以通过以下场景来形象化描述I / O等待时间:大家应该经历过或者已经在堵车中,有数百辆汽车在繁忙的道路上等待交通信号灯从“红色”切换为“绿色”。但是由于技术上的故障(此刻,交警也不在现场),交通信号灯从“红色”转换为“绿色”经历很长时间,迟迟没有发生更替。结果呢?数百辆汽车就傻傻的在原地等待,等待第三方介入处理。如果没有不及时处理,这将导致多种不良后果:乘客将无法及时到达目的地,驾驶员可能会感到沮丧并开始鸣喇叭(噪音污染),并且燃油将被浪费(空气污染),更有甚者直接无视交规,酿成大祸。
如何查找“等待” CPU时间?
可从以下来源找到等待的CPU时间:
1、可以使用基于网络的根本原因分析工具来报告“等待”的CPU时间。如果“等待” CPU时间超出阈值,该工具便能够生成警报。

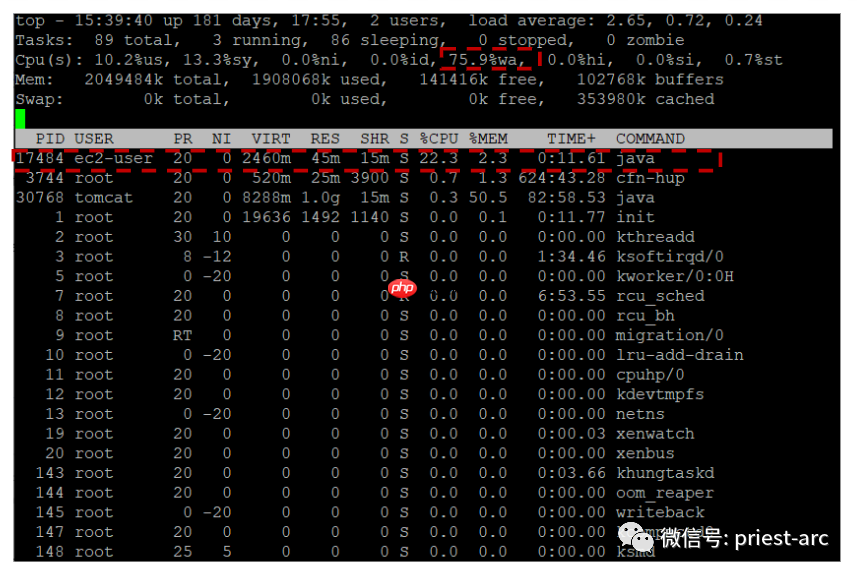
2、Linux/Unix命令行工具“ wa”字段中的“ top”中也能够打印“等待” CPU时间,如下图所示:
代码语言:javascript代码运行次数:0运行复制<code class="javascript">[administrator@JavaLangOutOfMemory nacos-docker ]% toptop - 20:50:49 up 20:39, 2 users, load average: 1.13, 0.86, 1.05Tasks: 123 total, 1 running, 122 sleeping, 0 stopped, 0 zombie%Cpu(s): 9.1 us, 6.2 sy, 0.0 ni, 83.9 id, 0.0 wa, 0.0 hi, 0.8 si, 0.0 stKiB Mem : 3880584 total, 1006448 free, 859684 used, 2014452 buff/cacheKiB Swap: 0 total, 0 free, 0 used. 2583448 avail Mem PID USER PR NI VIRT RES SHR S %CPU %MEM TIME+ COMMAND 2824 root 20 0 621140 357616 18272 S 10.9 9.2 118:20.09 kube-apiserver 2805 root 20 0 222392 49924 11240 S 7.6 1.3 81:42.59 kube-controller 11442 root 20 0 1512420 69476 33528 S 6.9 1.8 0:03.56 kubelet 2783 root 20 0 10.1g 58052 8152 S 5.3 1.5 48:55.54 etcd 1108 root 20 0 626628 85044 10092 S 4.3 2.2 45:54.18 dockerd 974 root 20 0 1078420 41340 4352 S 1.0 1.1 8:44.73 containerd 11794 root 20 0 162136 2248 1556 R 0.7 0.1 0:00.09 top 6 root 20 0 0 0 0 S 0.3 0.0 1:05.12 ksoftirqd/0 9 root 20 0 0 0 0 S 0.3 0.0 2:42.23 rcu_sched 395 root 20 0 0 0 0 S 0.3 0.0 2:26.41 xfsaild/dm-0 641 root 20 0 21540 1204 976 S 0.3 0.0 0:07.82 irqbalance 2858 root 20 0 147076 20348 6116 S 0.3 0.5 3:58.21 kube-scheduler 3884 root 20 0 142856 15952 4376 S 0.3 0.4 1:26.73 kube-proxy 11268 root 20 0 0 0 0 S 0.3 0.0 0:00.01 kworker/u4:0 1 root 20 0 125616 3692 2152 S 0.0 0.1 0:42.74 systemd 2 root 20 0 0 0 0 S 0.0 0.0 0:00.02 kthreadd 4 root 0 -20 0 0 0 S 0.0 0.0 0:00.00 kworker/0:0H 7 root rt 0 0 0 0 S 0.0 0.0 0:03.03 migration/0 8 root 20 0 0 0 0 S 0.0 0.0 0:00.00 rcu_bh 10 root 0 -20 0 0 0 S 0.0 0.0 0:00.00 lru-add-drain 11 root rt 0 0 0 0 S 0.0 0.0 0:05.44 watchdog/0</code>
如何模拟较高的“等待” CPU时间?
为了模拟高“等待” CPU报告,同样原理,与之前的“用户” CPU时间场景类似,我们写个简单的Demon。将其打成jar包,使其运行以模拟各种性能问题。当我们启动此应用jar包时,它将导致主机上的“等待” CPU消耗激增。具体如下:
代码语言:javascript代码运行次数:0运行复制<code class="javascript">[administrator@JavaLangOutOfMemory cpu ]% java -jar devopsDemo.jar PROBLEM_IOApplication started!Starting to write to iofile-01.logStarting to write to iofile-02.logStarting to write to iofile-03.logStarting to write to iofile-04.logStarting to write to iofile-05.logStarting to write to iofile-06.logRead & write 1000 times to iofile-05.logRead & write 1000 times to iofile-02.logRead & write 1000 times to iofile-01.logRead & write 1000 times to iofile-04.logRead & write 1000 times to iofile-03.logRead & write 1000 times to iofile-06.logRead & write 1000 times to iofile-04.logRead & write 1000 times to iofile-02.log... ...</code>
针对此应用jar包,我们看下其部分代码如下:
代码语言:javascript代码运行次数:0运行复制<code class="javascript">public class IODemo { public void start() { for (int counter =1; counter <= 6; ++counter) { // Launch 6 threads. new IOThread ("iofile-" + counter + ".log").start(); } } }public class IOThread extends Thread { public String fileName; public static final String CONTENT = "Hello CPU World! We are building a world where cpu resources are wasted and memmory resource are leaking. \n" + "Hello CPU World! We are building a world where cpu resources are wasted and memmory resource are leaking. \n" + "Hello CPU World! We are building a world where cpu resources are wasted and memmory resource are leaking. \n" + "Hello CPU World! We are building a world where cpu resources are wasted and memmory resource are leaking. \n" "Hello CPU World! We are building a world where cpu resources are wasted and memmory resource are leaking. \n" + "Hello CPU World! We are building a world where cpu resources are wasted and memmory resource are leaking. \n" + "Hello CPU World! We are building a world where cpu resources are wasted and memmory resource are leaking. \n" + "Hello CPU World! We are building a world where cpu resources are wasted and memmory resource are leaking. \n" public IOThread(String fileName) { this.fileName = fileName; } public void run() { int counter = 0; // Loop infinitely trying to read and close the file. while (true) { // Write the contents to the file. FileUtil.write(fileName, CONTENT); // Read the contents from the file. FileUtil.read(fileName); } } } </code>
如何解决高“等待时间”?
如果我们的资源设备的I / O等待时间过长,则可以尝试参考以下步骤进行优化及调整:
1、借助命令行及相关分析工具,该工具会指向应用程序中的代码行,从而导致较高的I / O等待时间。
2、可以通过执行以下操作来优化应用程序的等待时间:
(1)减少数据库调用次数
(2)优化数据库查询,以减少从数据库返回到应用程序的数据
(3)减少对外部应用程序进行的网络呼叫数量
(4)尝试最小化在外部应用程序和您的应用程序之间发送的有效负载量
(5)尝试减少写入磁盘的文件数量。
(6)尝试减少从磁盘读取的数据量。
(7)确保仅将基本日志语句写入磁盘。
3、确保我们的操作系统在安装了所有补丁程序的最新版本上运行。从安全性的角度来看,这不仅很好,而且还可以提高性能。
4、确保在设备上分配了足够的可用内存。缺少可用内存有两个有害影响:
(1)如果缺少可用内存,则将交换进程进出内存。磁盘将频繁写入和读取几页。它将增加磁盘I / O操作。
(2)如果可用内存较少,则操作系统将无法在内存中缓存常用磁盘块。当高速缓存的磁盘块被缓存时,I / O等待时间将减少。
5、将文件系统磁盘使用率保持在80%以下,以避免过多的碎片。当磁盘碎片过多时,I / O时间将增加。
6、如果上述所有步骤均失败,则我们也可以尝试考虑升级存储以提高性能。例如,可以考虑切换到更快的SSD,NVMe,SAN存储等。
以上就是Linux系统之Wait CPU time解析的详细内容,更多请关注php中文网其它相关文章!

每个人都需要一台速度更快、更稳定的 PC。随着时间的推移,垃圾文件、旧注册表数据和不必要的后台进程会占用资源并降低性能。幸运的是,许多工具可以让 Windows 保持平稳运行。

Copyright 2014-2025 https://www.php.cn/ All Rights Reserved | php.cn | 湘ICP备2023035733号


 436
436