
在编写windows和linux程序时,句柄泄露是一个常见的问题。在linux中,一个进程的文件描述符(fd)使用是有上限的,可以通过ulimit命令查看这个上限。当发生fd泄露时,可能会导致socket创建失败或文件无法打开等问题。windows也有类似的限制,本文主要介绍如何在windows中追踪句柄泄露的问题。
在Windows开发中,调用Windows API如CreateFile、CreateEvent、CreateThread等时,会返回一个句柄Handle。如果在使用完资源后没有调用CloseHandle关闭Handle,就会出现句柄泄露的问题。当这种情况发生时,再次调用如CreateThread可能会返回Windows错误代码1450,表示“系统资源不足以完成请求的服务”,从而导致程序运行问题。Windows系统的总句柄数是有限制的,这甚至可能影响其他进程的运行。接下来,我们将探讨如何定位句柄泄露问题。
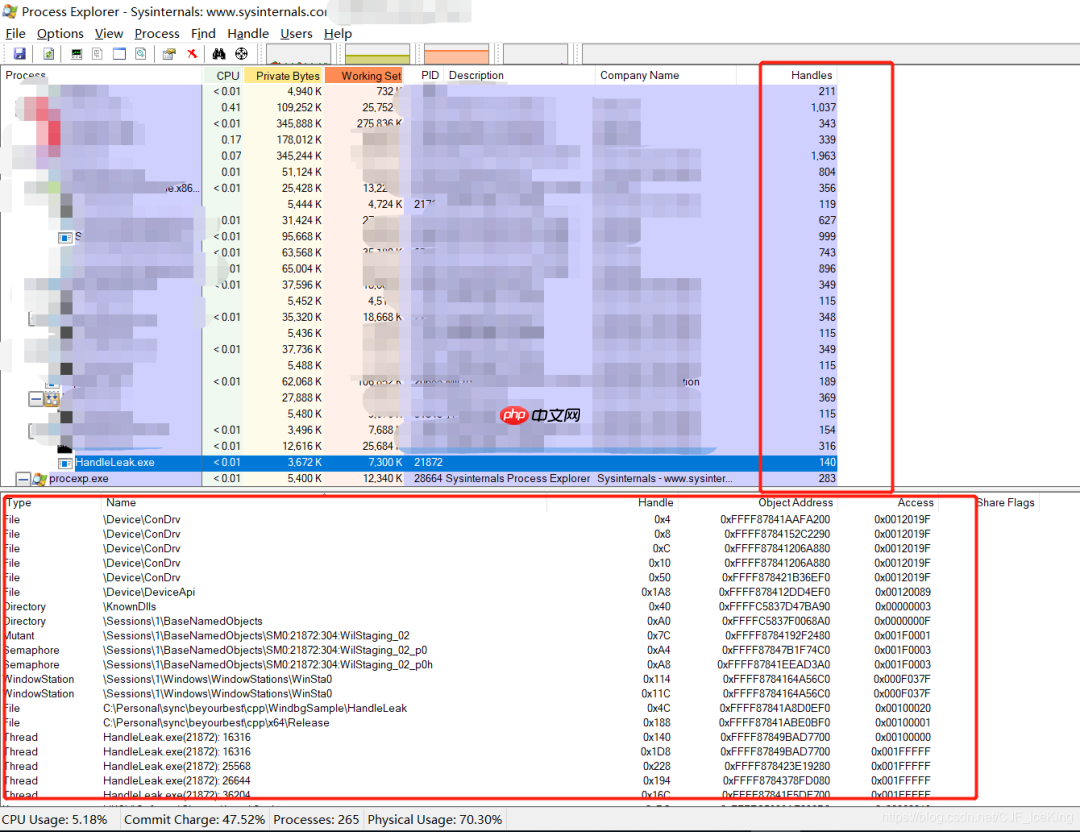
使用Process Explorer定位句柄泄露可以在任务管理器中查看进程的句柄数量,也可以在Process Explorer中查看。我们可以通过以下步骤来定位句柄泄露问题:
Process Explorer中显示Handles列,如果进程存在句柄泄露问题,该列的数值会持续增长。如果是由于CreateThread的句柄未释放导致的句柄泄露,可以在句柄详细信息中看到许多Thread类型的句柄,然后查找可能调用CreateThread的代码。
如果是由于CreateFile的句柄未释放,可以在Process Explorer中查看文件路径,根据文件路径查找可能引起句柄泄露的代码。
这种方法可以解决部分句柄泄露问题,但有时可能遇到无法解决的情况:
Process Explorer无法显示所有句柄,如无名的Event,导致无法查找。使用Windbg定位句柄泄露问题除了上述问题,是否有方法可以定位到导致句柄泄露的具体代码位置?Windbg可以做到。我们先看一段测试代码,每隔一秒创建一个Event,但没有调用CloseHandle,这会导致句柄泄露。
#include <windows.h>
#include <iostream>
#include <thread>
<p>void HandleLeak() {
int iCount = 0;
while (true) {
iCount++;
HANDLE hEvent = CreateEvent(NULL, TRUE, FALSE, NULL);
DWORD dwError = GetLastError();
std::this_thread::sleep_for(std::chrono::seconds(1));
if (!hEvent || dwError != ERROR_SUCCESS) {
std::cerr << "Failed to create event. Error code: " << dwError << std::endl;
break;
}
}
}</p><h2>int main() {
std::thread t(HandleLeak);
t.join();
return 0;
}第一步:使用Windbg附加到要测试的进程。
第二步:在Windbg中调用命令!htrace -enable,开启句柄追踪,并保存当前所有Handle的快照。
0:006> !htrace -enable
Handle tracing enabled.
Handle tracing information snapshot successfully taken.
第三步:在Windbg中调用命令g,让程序运行一段时间。
第四步:通过菜单Debug->Break进入调试状态,然后在Windbg中运行!htrace -diff,将进程当前的所有句柄与之前的快照进行对比,找出这段时间内多出来的句柄。
0:006> !htrace -diff
Handle tracing information snapshot successfully taken.
0x31 new stack traces since the previous snapshot.
Ignoring handles that were already closed...
Outstanding handles opened since the previous snapshot:</h2><h2>Handle = 0x0000000000000290 - OPEN
Thread ID = 0x0000000000001ca0, Process ID = 0x0000000000004360
0x00007ffca4dcb2a4: ntdll!NtCreateEvent+0x0000000000000014
0x00007ffca1ebb623: KERNELBASE!CreateEventA+0x0000000000000083
0x00007ff7ea001e94: HandleLeak!HandleLeak+0x0000000000000034
0x00007ff7ea002099: HandleLeak!main+0x0000000000000009
0x00007ff7ea0023d4: HandleLeak!__scrt_common_main_seh+0x000000000000010c
0x00007ffca23f4034: KERNEL32!BaseThreadInitThunk+0x0000000000000014
0x00007ffca4da3691: ntdll!RtlUserThreadStart+0x0000000000000021</h2><p>Handle = 0x0000000000000280 - OPEN
Thread ID = 0x0000000000001ca0, Process ID = 0x0000000000004360
0x00007ffca4dcb2a4: ntdll!NtCreateEvent+0x0000000000000014
0x00007ffca1ebb623: KERNELBASE!CreateEventA+0x0000000000000083
0x00007ff7ea001e94: HandleLeak!HandleLeak+0x0000000000000034
0x00007ff7ea002099: HandleLeak!main+0x0000000000000009
0x00007ff7ea0023d4: HandleLeak!__scrt_common_main_seh+0x000000000000010c
0x00007ffca23f4034: KERNEL32!BaseThreadInitThunk+0x0000000000000014
0x00007ffca4da3691: ntdll!RtlUserThreadStart+0x0000000000000021
第五步:通过上述Handle调用栈,可以很容易地找到导致句柄泄露的代码。
以上就是句柄泄露问题追踪的详细内容,更多请关注php中文网其它相关文章!

每个人都需要一台速度更快、更稳定的 PC。随着时间的推移,垃圾文件、旧注册表数据和不必要的后台进程会占用资源并降低性能。幸运的是,许多工具可以让 Windows 保持平稳运行。

 广告
广告


Copyright 2014-2025 https://www.php.cn/ All Rights Reserved | php.cn | 湘ICP备2023035733号


 953
953