


众所周知r软件功能非常强大,可以很好的进行各类统计,并能输出图形。下面介绍一种r语言和c#进行通信的方法,并将r绘图结果显示到winform ui界面上的方法,文中介绍的很详细,需要的朋友可以参考下。
一、前提准备
安装R软件,需要安装32位的R软件,64位的调用会报错。另外就是讲R添加到电脑环境变量中。
打开R软件,安装包 scatterplot3d,演示需要用到此R包。
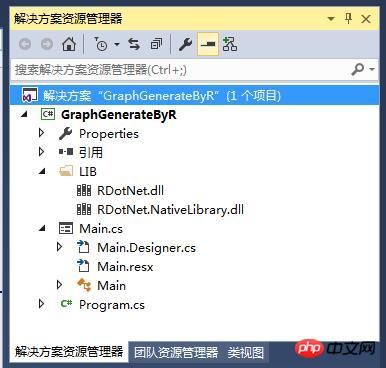
二、创建项目GraphGenerateByR,项目结构如下:
注意:这里需要引入RDotNet类库,可以自行下载:http://rdotnet.codeplex.com/
三、Main窗体代码

using System;
using System.Collections.Generic;
using System.ComponentModel;
using System.Data;
using System.Drawing;
using System.Linq;
using System.Text;
using System.Windows.Forms;

namespace GraphGenerateByR
{
 using RDotNet;
 public partial class Main : Form
 {
  public Main()
  {
   InitializeComponent();
  }
  REngine engine = null;

  string Rcode = "";
  private void btnPlot_Click(object sender, EventArgs e)
  {
   try
   {
    if(this.txtRcode.Text=="")
    {
     Rcode = @"library('scatterplot3d')
       z <- seq(-10, 10, 0.01)
       x <- cos(z)
       y <- sin(z)
       scatterplot3d(x, y, z, highlight.3d=TRUE, col.axis='blue', col.grid='lightblue',main='3d绘图',pch=20)
       ";
    }
    else
    {
     Rcode = this.txtRcode.Text;
    }

    //R.3.2.4
    engine = REngine.GetInstance();
    engine.Initialize();
    //图片加入GUID,防止重名(还有一种就是先删除后保存)
    string rnd = System.Guid.NewGuid().ToString().Replace("-", "");
    string filename ="i"+ rnd+ "Rimage.png";
    engine.Evaluate(string.Format("png(file='{0}',bg ='transparent',width={1},height={2})", filename, this.ptbGraphic.Width, this.ptbGraphic.Height));

    //engine.Evaluate(@"x <- (0:12) * pi / 12
    //    y <- cos(x)
    //    plot(x,y);
    //    ");
    engine.Evaluate(Rcode);
    engine.Evaluate("dev.off()");
    string path = System.IO.Path.GetFullPath(filename);

    Bitmap image = new Bitmap(path);
    ptbGraphic.Image = image;
   }
   catch(Exception ex)
   {
    MessageBox.Show(ex.Message);
   }

  }

  private void Main_FormClosing(object sender, FormClosingEventArgs e)
  {
   if(engine!=null)
   {
    //clean up
    engine.Dispose();
   }
  }
 }
}
四、运行:
单击plot后,调用默认R代码,结构如下:
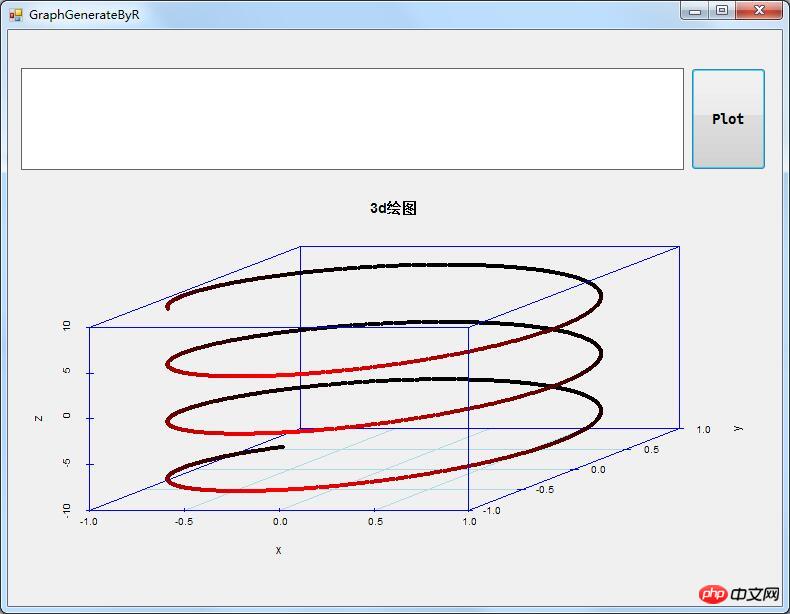
输入合法的R绘图语句,再次单击Plot,结果如下:

总结


