本文主要介绍了jquery插件echarts设置折线图中折线线条颜色和折线点颜色的方法,结合实例形式分析了jquery图表插件echarts设置折线图的相关操作技巧,需要的朋友可以参考下,希望能帮助到大家。
1、问题背景
设计一条折线图,但是图形中不用插件自带的颜色,需要自定义线条和折点的颜色
2、实现源码
(1)图形自分配颜色
<!DOCTYPE html>
<html>
  <head>
    <meta charset="UTF-8">
    <title>echarts-设置折线图中折线线条颜色和折线点颜色</title>
    <link rel="shortcut icon" href="../js/echarts-2.2.7/doc/asset/ico/favicon.png" rel="external nofollow" rel="external nofollow" rel="external nofollow" >
    <script type="text/javascript" src="../js/echarts-2.2.7/doc/asset/js/jquery.min.js" ></script>
    <script type="text/javascript" src="../js/echarts-2.2.7/doc/example/www2/js/echarts-all.js" ></script>
    <style>
      body,html{
        width: 99%;
        height: 99%;
        font-family: "微软雅黑";
        font-size: 12px;
      }
      #line{
        width: 100%;
        height: 100%;
      }
    </style>
    <script>
      $(function(){
        var chart = document.getElementById('line');
        var echart = echarts.init(chart);
        var option = {
          title: {
            text: ''
          },
          tooltip: {
            trigger: 'axis'
          },
          legend: {
            data:['销售量']
          },
          grid: {
            left: '3%',
            right: '4%',
            bottom: '3%',
            containLabel: true
          },
          toolbox: {
            feature: {
              saveAsImage: {}
            }
          },
          xAxis: {
            type: 'category',
            boundaryGap: false,
            data: ['周一','周二','周三','周四','周五','周六','周日']
          },
          yAxis: {
            type: 'value'
          },
          series: [
            {
              name:'销售量',
              type:'line',
              stack: '销售量',
              data:[220, 132, 601, 314, 890, 230, 510]
            }
          ]
        };
        echart.setOption(option);
      });
    </script>
  </head>
  <body>
    <p id="line"></p>
  </body>
</html>(2)线条自定义颜色
<!DOCTYPE html>
<html>
  <head>
    <meta charset="UTF-8">
    <title>echarts-设置折线图中折线线条颜色和折线点颜色</title>
    <link rel="shortcut icon" href="../js/echarts-2.2.7/doc/asset/ico/favicon.png" rel="external nofollow" rel="external nofollow" rel="external nofollow" >
    <script type="text/javascript" src="../js/echarts-2.2.7/doc/asset/js/jquery.min.js" ></script>
    <script type="text/javascript" src="../js/echarts-2.2.7/doc/example/www2/js/echarts-all.js" ></script>
    <style>
      body,html{
        width: 99%;
        height: 99%;
        font-family: "微软雅黑";
        font-size: 12px;
      }
      #line{
        width: 100%;
        height: 100%;
      }
    </style>
    <script>
      $(function(){
        var chart = document.getElementById('line');
        var echart = echarts.init(chart);
        var option = {
          title: {
            text: ''
          },
          tooltip: {
            trigger: 'axis'
          },
          legend: {
            data:['销售量']
          },
          grid: {
            left: '3%',
            right: '4%',
            bottom: '3%',
            containLabel: true
          },
          toolbox: {
            feature: {
              saveAsImage: {}
            }
          },
          xAxis: {
            type: 'category',
            boundaryGap: false,
            data: ['周一','周二','周三','周四','周五','周六','周日']
          },
          yAxis: {
            type: 'value'
          },
          series: [
            {
              name:'销售量',
              type:'line',
              stack: '销售量',
              itemStyle : {
                normal : {
                  lineStyle:{
                    color:'#00FF00'
                  }
                }
              },
              data:[220, 132, 601, 314, 890, 230, 510]
            }
          ]
        };
        echart.setOption(option);
      });
    </script>
  </head>
  <body>
    <p id="line"></p>
  </body>
</html>(3)折点自定义颜色
<!DOCTYPE html>
<html>
<head>
<meta charset="UTF-8">
<title>echarts-设置折线图中折线线条颜色和折线点颜色</title>
<link rel="shortcut icon" href="../js/echarts-2.2.7/doc/asset/ico/favicon.png" rel="external nofollow" rel="external nofollow" rel="external nofollow" >
<script type="text/javascript" src="../js/echarts-2.2.7/doc/asset/js/jquery.min.js" ></script>
<script type="text/javascript" src="../js/echarts-2.2.7/doc/example/www2/js/echarts-all.js" ></script>
<style>
body,html{
width: 99%;
height: 99%;
font-family: "微软雅黑";
font-size: 12px;
}
#line{
width: 100%;
height: 100%;
}
</style>
<script>
$(function(){
var chart = document.getElementById('line');
var echart = echarts.init(chart);
var option = {
title: {
text: ''
},
tooltip: {
trigger: 'axis'
},
legend: {
data:['销售量']
},
grid: {
left: '3%',
right: '4%',
bottom: '3%',
containLabel: true
},
toolbox: {
feature: {
saveAsImage: {}
}
},
xAxis: {
type: 'category',
boundaryGap: false,
data: ['周一','周二','周三','周四','周五','周六','周日']
},
yAxis: {
type: 'value'
},
series: [
{
name:'销售量',
type:'line',
stack: '销售量',
itemStyle : {
normal : {
color:'#00FF00',
lineStyle:{
color:'#00FF00'
}
}
},
data:[220, 132, 601, 314, 890, 230, 510]
}
]
};
echart.setOption(option);
});
</script>
</head>
<body>
<p id="line"></p>
</body>
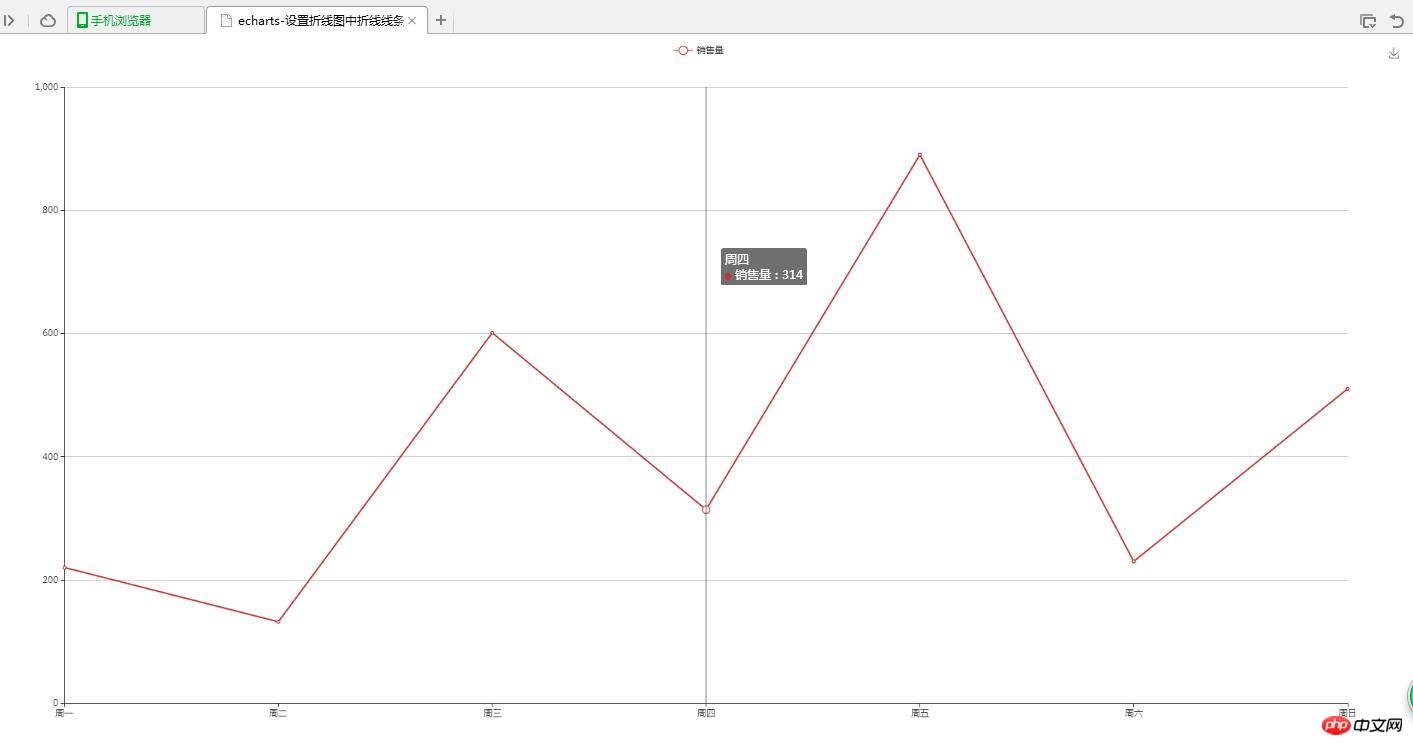
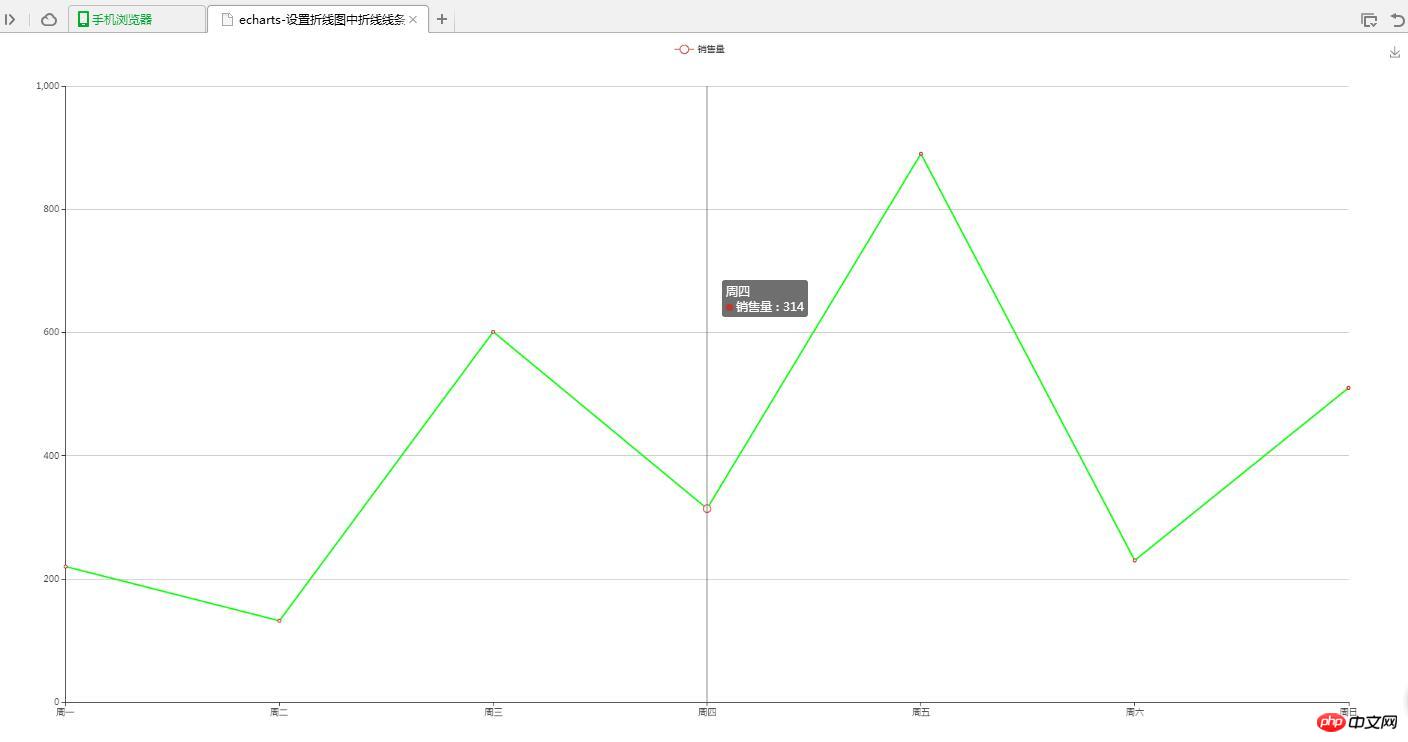
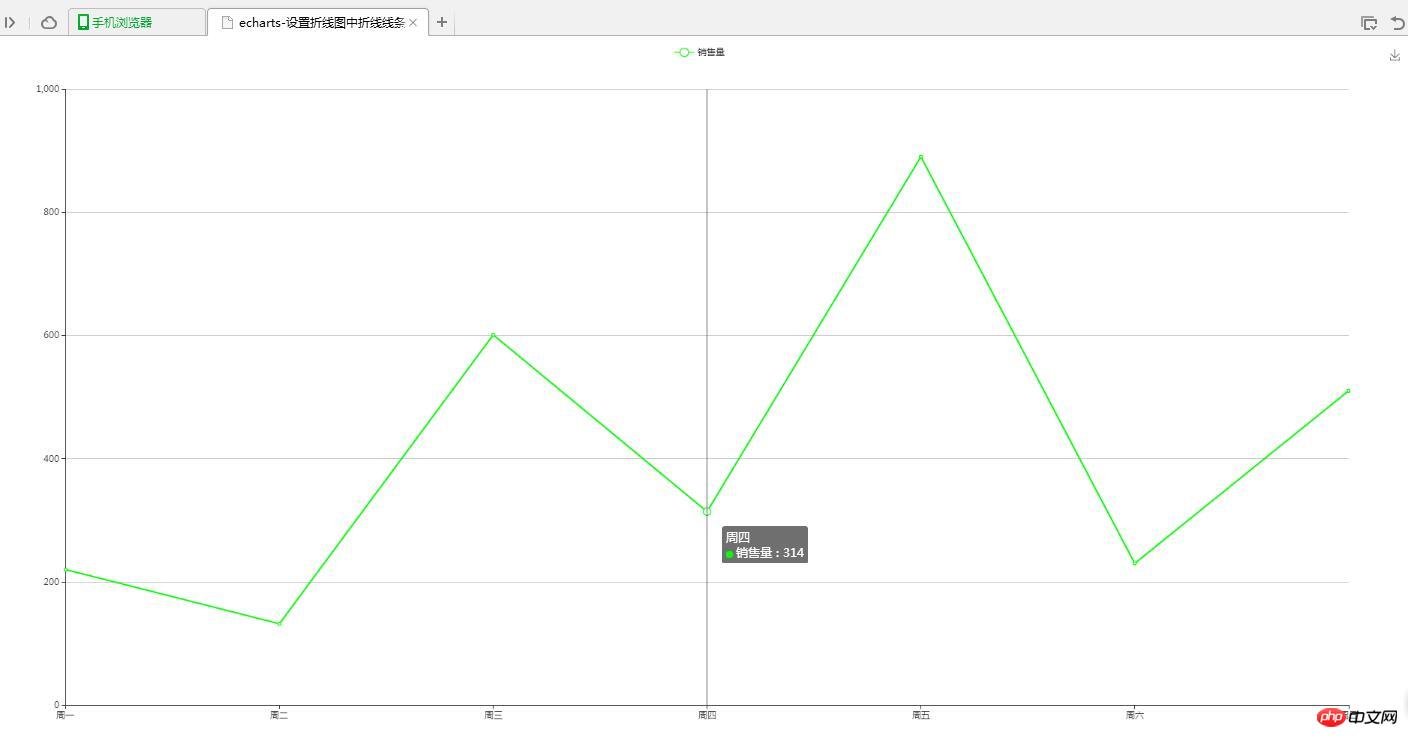
</html>3、实现结果
(1)图形自分配颜色
(2)线条自定义颜色

1:强大的用户管理面版2:分为无需注册的免费发布和VIP注册发布/管理两个系统功能3:注册简便,发布信息管理信息等都相当简单4:用户积分制度5:4 个非常实用的道具(在后台设置道具参数)标题变色道具 (改变标题颜色)信息置顶道具 (能使发布信息置顶,使用个数越多,位置越高)内容贴图道具 (可以发和信息相关的图片)通过验证道具 (可不通过管理员审核,直接发布)6:采用虚拟货币制度,可以在线购买虚拟货
 0
0

(3)折点自定义颜色
4、问题说明
(1)设置折线线条颜色
lineStyle:{
 color:'#00FF00'
}(2)设置折线折点颜色
itemStyle : {
 normal : {
  color:'#00FF00'
 }
}相关推荐:
以上就是echarts设置折线线条颜色和折线点颜色的实例的详细内容,更多请关注php中文网其它相关文章!

每个人都需要一台速度更快、更稳定的 PC。随着时间的推移,垃圾文件、旧注册表数据和不必要的后台进程会占用资源并降低性能。幸运的是,许多工具可以让 Windows 保持平稳运行。

Copyright 2014-2025 https://www.php.cn/ All Rights Reserved | php.cn | 湘ICP备2023035733号


 342
342