这篇文章主要介绍了python使用add_subplot与subplot画子图操作,涉及python使用matplotlib模块进行图形绘制的相关操作技巧,需要的朋友可以参考下
本文实例讲述了Python使用add_subplot与subplot画子图操作。分享给大家供大家参考,具体如下:
子图:就是在一张figure里面生成多张子图。
Matplotlib对象简介
FigureCanvas 画布
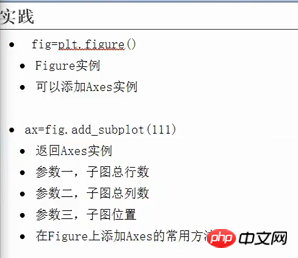
Figure 图
Axes 坐标轴(实际画图的地方)
立即学习“Python免费学习笔记(深入)”;
注意,pyplot的方式中plt.subplot()参数和面向对象中的add_subplot()参数和含义都相同。
使用面向对象的方式
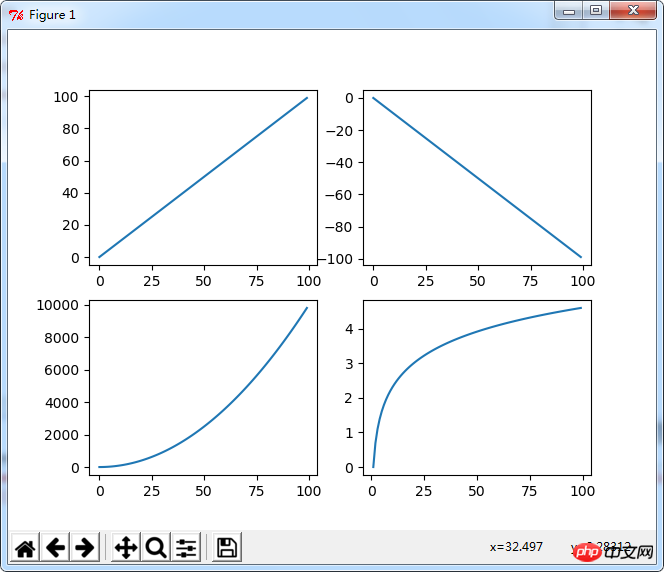
#!/usr/bin/python
#coding: utf-8
import numpy as np
import matplotlib.pyplot as plt
x = np.arange(0, 100)
fig = plt.figure()
ax1 = fig.add_subplot(221)
ax1.plot(x, x)
ax2 = fig.add_subplot(222)
ax2.plot(x, -x)
ax3 = fig.add_subplot(223)
ax3.plot(x, x ** 2)
ax4 = fig.add_subplot(224)
ax4.plot(x, np.log(x))
plt.show()
时尚购物程序v1.01、全立体设计。此系统由3个Flash动画为主线(正式版带原文件),设计更形象,网站更有吸引力。这种设计在网店系统内绝无仅有,使您的网店与众不同。2、内置音乐播放器,简单灵活的操作即可完成设置,前台任意调用。并带详细说明文件,一看就懂。合理使用此功能,可使网站更富渲染力。3、支持多图显示,每件产品最多可以上传9张图片。4、后台功能强大,销售管理,财务管理,在线支付平台管理等功能
 0
0

pyplot的方式
#!/usr/bin/python
#coding: utf-8
import numpy as np
import matplotlib.pyplot as plt
x = np.arange(0, 100)
plt.subplot(221)
plt.plot(x, x)
plt.subplot(222)
plt.plot(x, -x)
plt.subplot(223)
plt.plot(x, x ** 2)
plt.subplot(224)
plt.plot(x, np.log(x))
plt.show()
运行结果:
相关推荐:
以上就是Python使用add_subplot与subplot画子图操作的详细内容,更多请关注php中文网其它相关文章!

python怎么学习?python怎么入门?python在哪学?python怎么学才快?不用担心,这里为大家提供了python速学教程(入门到精通),有需要的小伙伴保存下载就能学习啦!

 广告
广告Copyright 2014-2025 https://www.php.cn/ All Rights Reserved | php.cn | 湘ICP备2023035733号


 634
634