在您的软件工程职业生涯中,您可能会遇到一段性能不佳的代码,花费的时间超出了可接受的范围。更糟糕的是,多次执行时性能不一致且变化很大。
此时,您必须接受这样的事实:在软件性能方面,存在很多不确定性。数据可以分布在一个窗口内,有时遵循正态分布。其他时候,它可能会不稳定,没有明显的模式。
这就是基准测试发挥作用的时候。执行代码五次固然很好,但最终,您只有五个数据点,每个数据点都具有太多价值。我们需要对同一代码块进行更多次的重复才能看到模式。
一个人应该有多少个数据点?关于它已经有很多文章了,我报道过其中一篇论文
严格的绩效评估需要建立基准, 多次执行和测量以处理随机 执行时间的变化。研究人员应该提供措施 报告结果时的变化。
kalibera, t. 和 jones, r. (2013)。在合理的时间内进行严格的基准测试。 2013年内存管理国际研讨会论文集 https://doi.org/10.1145/2491894.2464160
在测量性能时,我们可能希望测量 cpu、内存或磁盘使用情况,以更全面地了解性能。通常最好从简单的事情开始,比如流逝的时间,因为它更容易形象化。 17% 的 cpu 使用率并不能告诉我们太多信息。应该是什么? 20%还是5%? cpu 使用率并不是人类感知性能的自然方式之一。
我将使用python的timeit.repeat方法来重复一个简单的代码执行块。该代码块只是将 1 到 2000 之间的数字相乘。
from functools import reduce
reduce((lambda x, y: x * y), range(1, 2000))
这是方法签名
(function) def repeat(
    stmt: _stmt = "pass",
    setup: _stmt = "pass",
    timer: _timer = ...,
    repeat: int = 5,
    number: int = 1000000,
    globals: dict[str, any] | none = none
) -> list[float]
什么是重复和数字?
让我们从数字开始。如果代码块太小,它会很快终止,以至于您无法测量任何内容。这个参数提到了 stmt 必须执行的次数。您可以将其视为新的代码块。返回的浮点数是 stmt x 号执行时间。
在我们的例子中,我们将数字保留为 1000,因为乘法到 2000 的成本很高。
接下来,继续重复。这指定了上述块必须执行的重复次数或次数。如果重复次数为 5,则 list[float] 返回 5 个元素。
让我们从创建一个简单的执行块开始
def run_experiment(number_of_repeats, number_of_runs=1000):
    execution_time = timeit.repeat(
        "from functools import reduce; reduce((lambda x, y: x * y), range(1, 2000))",
        repeat=number_of_repeats,
        number=number_of_runs
    )
    return execution_time
我们想以不同的重复值执行它
repeat_values = [5, 20, 100, 500, 3000, 10000]
代码非常简单明了
现在我们到达了实验中最重要的部分——解释数据。请注意,不同的人有不同的解释,并且没有单一的正确答案。
您对正确答案的定义很大程度上取决于您想要实现的目标。您是否担心 95% 用户的性能下降?或者,您是否担心尾部 5% 的直言不讳的用户的性能下降?
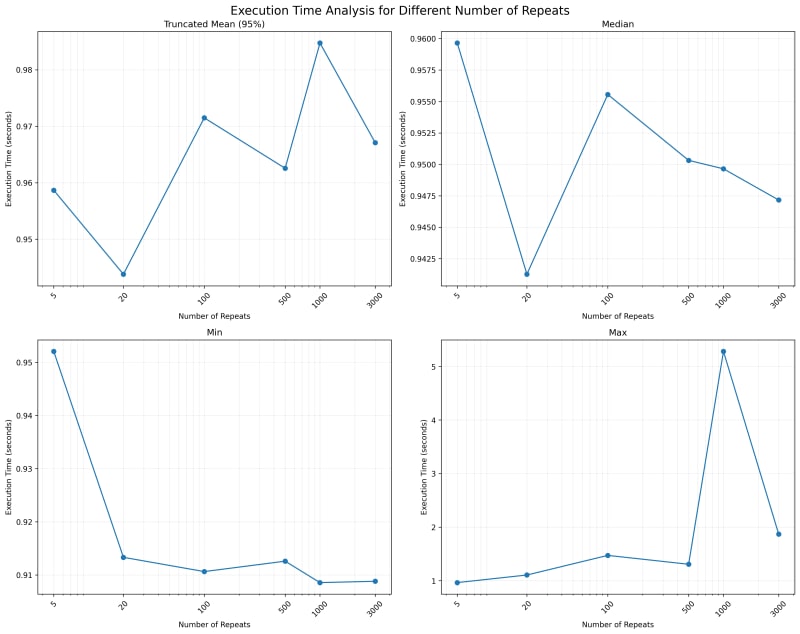
正如我们所看到的,最短和最长时间是奇怪的。它展示了一个数据点如何足以改变均值。最糟糕的是,高最小值和高最大值适用于不同的重复值。没有相关性,它只是展示了异常值的力量。
接下来我们转向中位数,并注意到随着重复次数的增加,中位数会下降,除了 20 之外。可以用什么解释呢?它只是表明较少的重复次数意味着我们不一定能全面了解可能的值。
转向截断平均值,其中最低的 2.5% 和最高的 2.5% 被修剪掉。当您不关心异常用户并希望关注中间 95% 用户的表现时,这非常有用。
请注意,尝试提高中间 95% 用户的性能可能会降低异常 5% 用户的性能。
接下来我们想看看所有数据都在哪里。我们将使用 bin 为 10 的直方图来查看数据落在哪里。重复 5 次后,我们发现它们的间距基本相等。这不是人们通常所期望的,因为采样数据应该遵循正态分布。
在我们的例子中,该值的下侧有界,上侧无界,因为运行任何代码都将花费超过 0 秒的时间,但没有上限时间限制。这意味着我们的分布应该看起来像具有长右尾的正态分布。
随着重复值的增加,我们看到右侧出现了一条尾巴。我预计随着重复次数的增加,将会出现一个直方图条,该条的高度足以使异常值被掩盖。
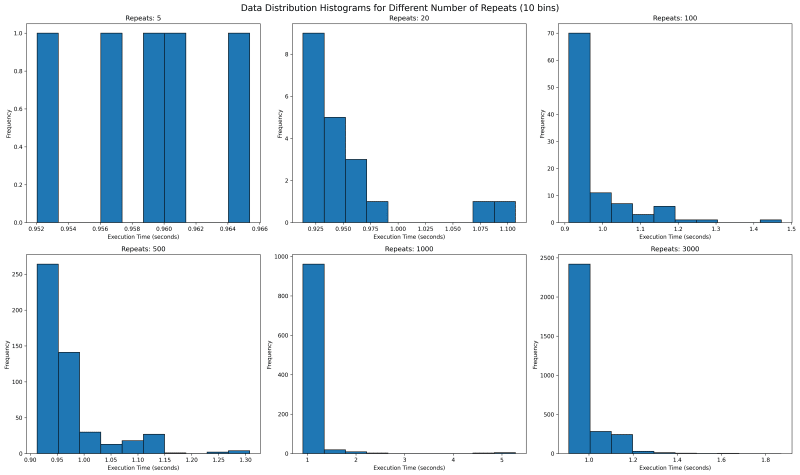
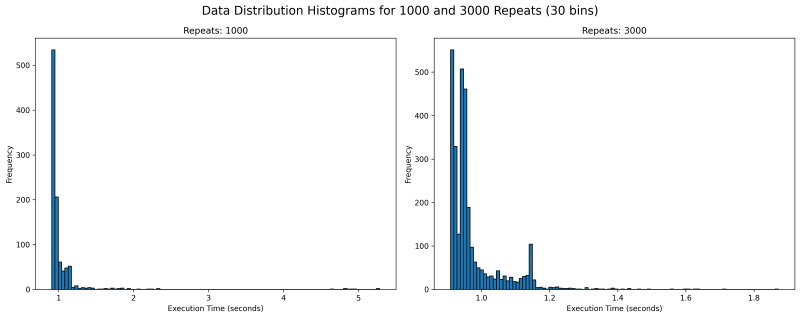
我们看看更大的重复值来了解一下怎么样?我们看到一些不寻常的东西。重复 1000 次后,有很多超过 1.8 的异常值,而且看起来更紧密。右边那个重复次数为 3000 的数据仅达到 1.8,并且大部分数据都聚集在两个峰值周围。
这意味着什么?它可能意味着很多事情,包括有时数据可能被缓存,有时却没有。它可以指出代码的许多其他副作用,这些副作用是您可能从未想到的。对于 1000 次和 3000 次重复的分布,我觉得 3000 次重复的 tm95 是最准确的值。
import timeit
import matplotlib.pyplot as plt
import json
import os
import statistics
import numpy as np

def run_experiment(number_of_repeats, number_of_runs=1000):
    execution_time = timeit.repeat(
        "from functools import reduce; reduce((lambda x, y: x * y), range(1, 2000))",
        repeat=number_of_repeats,
        number=number_of_runs
    )
    return execution_time

def save_result(result, repeats):
    filename = f'execution_time_results_{repeats}.json'
    with open(filename, 'w') as f:
        json.dump(result, f)

def load_result(repeats):
    filename = f'execution_time_results_{repeats}.json'
    if os.path.exists(filename):
        with open(filename, 'r') as f:
            return json.load(f)
    return None

def truncated_mean(data, percentile=95):
    data = np.array(data)
    lower_bound = np.percentile(data, (100 - percentile) / 2)
    upper_bound = np.percentile(data, 100 - (100 - percentile) / 2)
    return np.mean(data[(data >= lower_bound) & (data <= upper_bound)])

# List of number_of_repeats to test
repeat_values = [5, 20, 100, 500, 1000, 3000]

# Run experiments and collect results
results = []
for repeats in repeat_values:
    result = load_result(repeats)
    if result is None:
        print(f"Running experiment for {repeats} repeats...")
        try:
            result = run_experiment(repeats)
            save_result(result, repeats)
            print(f"Experiment for {repeats} repeats completed and saved.")
        except KeyboardInterrupt:
            print(f"\nExperiment for {repeats} repeats interrupted.")
            continue
    else:
        print(f"Loaded existing results for {repeats} repeats.")

    # Print time taken per repetition
    avg_time = statistics.mean(result)
    print(f"Average time per repetition for {repeats} repeats: {avg_time:.6f} seconds")

    results.append(result)

trunc_means = [truncated_mean(r) for r in results]
medians = [np.median(r) for r in results]
mins = [np.min(r) for r in results]
maxs = [np.max(r) for r in results]

# Create subplots
fig, axs = plt.subplots(2, 2, figsize=(15, 12))
fig.suptitle('Execution Time Analysis for Different Number of Repeats', fontsize=16)

metrics = [
    ('Truncated Mean (95%)', trunc_means),
    ('Median', medians),
    ('Min', mins),
    ('Max', maxs)
]

for (title, data), ax in zip(metrics, axs.flatten()):
    ax.plot(repeat_values, data, marker='o')
    ax.set_title(title)
    ax.set_xlabel('Number of Repeats')
    ax.set_ylabel('Execution Time (seconds)')
    ax.set_xscale('log')
    ax.grid(True, which="both", ls="-", alpha=0.2)

    # Set x-ticks and labels for each data point
    ax.set_xticks(repeat_values)
    ax.set_xticklabels(repeat_values)

    # Rotate x-axis labels for better readability
    ax.tick_params(axis='x', rotation=45)

plt.tight_layout()

# Save the plot to a file
plt.savefig('execution_time_analysis.png', dpi=300, bbox_inches='tight')
print("Plot saved as 'execution_time_analysis.png'")

# Create histograms for data distribution with 10 bins
fig, axs = plt.subplots(2, 3, figsize=(20, 12))
fig.suptitle('Data Distribution Histograms for Different Number of Repeats (10 bins)', fontsize=16)

for repeat, result, ax in zip(repeat_values, results, axs.flatten()):
    ax.hist(result, bins=10, edgecolor='black')
    ax.set_title(f'Repeats: {repeat}')
    ax.set_xlabel('Execution Time (seconds)')
    ax.set_ylabel('Frequency')

plt.tight_layout()

# Save the histograms to a file
plt.savefig('data_distribution_histograms_10bins.png', dpi=300, bbox_inches='tight')
print("Histograms saved as 'data_distribution_histograms_10bins.png'")

# Create histograms for 1000 and 3000 repeats with 30 bins
fig, axs = plt.subplots(1, 2, figsize=(15, 6))
fig.suptitle('Data Distribution Histograms for 1000 and 3000 Repeats (30 bins)', fontsize=16)

for repeat, result, ax in zip([1000, 3000], results[-2:], axs):
    ax.hist(result, bins=100, edgecolor='black')
    ax.set_title(f'Repeats: {repeat}')
    ax.set_xlabel('Execution Time (seconds)')
    ax.set_ylabel('Frequency')

plt.tight_layout()

# Save the detailed histograms to a file
plt.savefig('data_distribution_histograms_detailed.png', dpi=300, bbox_inches='tight')
print("Detailed histograms saved as 'data_distribution_histograms_detailed.png'")

plt.show()
以上就是timeitrepeat - 通过重复来理解模式的详细内容,更多请关注php中文网其它相关文章!

每个人都需要一台速度更快、更稳定的 PC。随着时间的推移,垃圾文件、旧注册表数据和不必要的后台进程会占用资源并降低性能。幸运的是,许多工具可以让 Windows 保持平稳运行。

Copyright 2014-2025 https://www.php.cn/ All Rights Reserved | php.cn | 湘ICP备2023035733号


 456
456