bpf 最初是为bsd操作系统开发,全称是 「Berkeley Packet Filter」 ,翻译过来是 「伯克利包过滤器」 ,顾名思义,它是在伯克利大学诞生的,1992年Steven McCanne 和 Van Jacobson 写了一篇 《The BSD Packet Filter: A New Architecture for User-level Packet Capture》论文用户使用bpf 虚拟机的指令集(bpf字节码)定义过滤器表达式,然后传递给内核, 由解释器执行。从而使得包过滤器可以在内核中直接执行。避免向用户态进程复制每个数据包,从而提升数据包过滤的性能。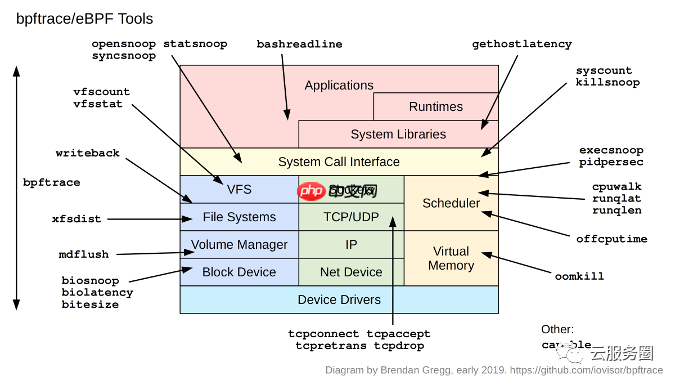
工具体验
代码语言:javascript代码运行次数:0运行复制root@heidsoft-dev:~# apt-get install libbpfccReading package lists... DoneBuilding dependency tree Reading state information... DoneThe following packages were automatically installed and are no longer required: libclang-common-7-dev libclang1-7 liblldb-12 libllvm7 libz3-4 libz3-dev llvm-12-runtime llvm-12-tools llvm-9-runtime llvm-9-tools python3-lldb-12Use 'apt autoremove' to remove them.The following packages will be REMOVED: bcc-tools libbcc libbcc-examples python-bccThe following NEW packages will be installed: libbpfcc0 upgraded, 1 newly installed, 4 to remove and 183 not upgraded.Need to get 14.9 MB of archives.After this operation, 15.3 MB of additional disk space will be used.Do you want to continue? [Y/n] yGet:1 http://cn.archive.ubuntu.com/ubuntu focal/universe amd64 libbpfcc amd64 0.12.0-2 [14.9 MB]Fetched 14.9 MB in 7s (1,995 kB/s) (Reading database ... 282090 files and directories currently installed.)Removing bcc-tools (0.10.0-34.git.6836168) ...Removing python-bcc (0.10.0-34.git.6836168) ...Removing libbcc-examples (0.10.0-34.git.6836168) ...Removing libbcc (0.10.0-34.git.6836168) ...Selecting previously unselected package libbpfcc.(Reading database ... 281556 files and directories currently installed.)Preparing to unpack .../libbpfcc_0.12.0-2_amd64.deb ...Unpacking libbpfcc (0.12.0-2) ...Setting up libbpfcc (0.12.0-2) ...Processing triggers for libc-bin (2.31-0ubuntu9.7) ...root@heidsoft-dev:~# apt-get install bpftraceReading package lists... DoneBuilding dependency tree Reading state information... DoneThe following packages were automatically installed and are no longer required: libclang-common-7-dev libclang1-7 liblldb-12 libllvm7 libz3-4 libz3-dev llvm-12-runtime llvm-12-tools llvm-9-runtime llvm-9-tools python3-lldb-12Use 'apt autoremove' to remove them.The following NEW packages will be installed: bpftrace0 upgraded, 1 newly installed, 0 to remove and 183 not upgraded.Need to get 457 kB of archives.After this operation, 1,547 kB of additional disk space will be used.Get:1 http://cn.archive.ubuntu.com/ubuntu focal/universe amd64 bpftrace amd64 0.9.4-1 [457 kB]Fetched 457 kB in 3s (160 kB/s) Selecting previously unselected package bpftrace.(Reading database ... 281568 files and directories currently installed.)Preparing to unpack .../bpftrace_0.9.4-1_amd64.deb ...Unpacking bpftrace (0.9.4-1) ...Setting up bpftrace (0.9.4-1) ...Processing triggers for man-db (2.9.1-1) ...root@heidsoft-dev:~# bpftrace --helpUSAGE: bpftrace [options] filename bpftrace [options] -e 'program'OPTIONS: -B MODE output buffering mode ('full', 'none') -f FORMAT output format ('text', 'json') -o file redirect bpftrace output to file -d debug info dry run -dd verbose debug info dry run -b force BTF (BPF type format) processing -e 'program' execute this program -h, --help show this help message -I DIR add the directory to the include search path --include FILE add an #include file before preprocessing -l [search] list probes -p PID enable USDT probes on PID -c 'CMD' run CMD and enable USDT probes on resulting process --unsafe allow unsafe builtin functions -v verbose messages --info Print information about kernel BPF support -V, --version bpftrace versionENVIRONMENT: BPFTRACE_STRLEN [default: 64] bytes on BPF stack per str() BPFTRACE_NO_CPP_DEMANGLE [default: 0] disable C++ symbol demangling BPFTRACE_MAP_KEYS_MAX [default: 4096] max keys in a map BPFTRACE_CAT_BYTES_MAX [default: 10k] maximum bytes read by cat builtin BPFTRACE_MAX_PROBES [default: 512] max number of probes BPFTRACE_LOG_SIZE [default: 409600] log size in bytes BPFTRACE_NO_USER_SYMBOLS [default: 0] disable user symbol resolution BPFTRACE_VMLINUX [default: None] vmlinux path used for kernel symbol resolution BPFTRACE_BTF [default: None] BTF fileEXAMPLES:bpftrace -l '*sleep*' list probes containing "sleep"bpftrace -e 'kprobe:do_nanosleep { printf("PID %d sleeping...\n", pid); }' trace processes calling sleepbpftrace -e 'tracepoint:raw_syscalls:sys_enter { @[comm] = count(); }' count syscalls by process name bpftrace -e 'tracepoint:syscalls:sys_enter_open {printf("%s %s\n",comm,str(args->filename));}' bpftrace -e 'tracepoint:syscalls:sys_enter_open {printf("%s %s\n",comm,str(args->filename));}'bpftrace -l 'tracepoint:syscalls:sys_enter_open*'tracepoint:syscalls:sys_enter_open_by_handle_attracepoint:syscalls:sys_enter_open_treetracepoint:syscalls:sys_enter_opentracepoint:syscalls:sys_enter_openattracepoint:syscalls:sys_enter_openat2root@heidsoft-dev:~# bpftrace -e 'tracepoint:syscalls:sys_enter_open* { @[probe] = count(); }'Attaching 5 probes...^C@[tracepoint:syscalls:sys_enter_openat]: 33root@heidsoft-dev:~# opensnoop.bt Attaching 6 probes...Tracing open syscalls... Hit Ctrl-C to end.PID COMM FD ERR PATH891 irqbalance 2 0 /proc/interrupts891 irqbalance 2 0 /proc/stat891 irqbalance 2 0 /proc/irq/19/smp_affinity891 irqbalance 2 0 /proc/interrupts891 irqbalance 2 0 /proc/stat891 irqbalance 2 0 /proc/irq/19/smp_affinity833 vmtoolsd 2 0 /proc/meminfo833 vmtoolsd 2 0 /proc/vmstat833 vmtoolsd 2 0 /proc/stat833 vmtoolsd 2 0 /proc/zoneinfo833 vmtoolsd 2 0 /proc/uptime833 vmtoolsd 2 0 /proc/diskstats
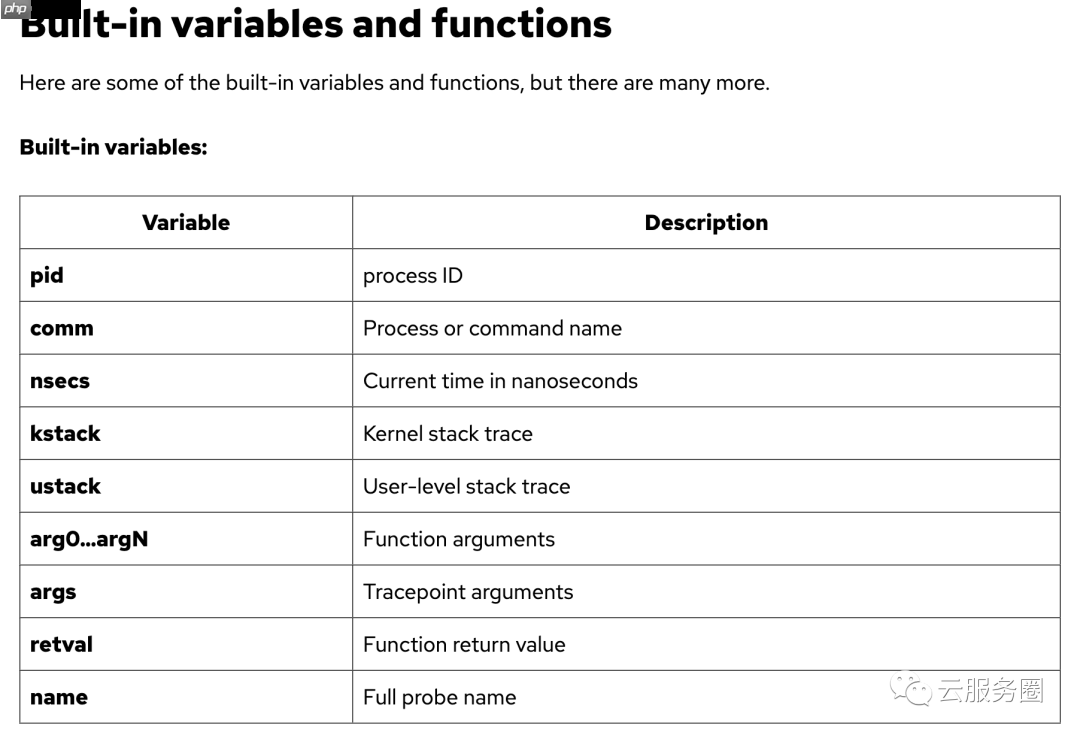
探针类型
Type
Description
tracepoint
Kernel static instrumentation points
usdt
User-level statically defined tracing
kprobe
Kernel dynamic function instrumentation
kretprobe
Kernel dynamic function return instrumentation
uprobe
User-level dynamic function instrumentation
uretprobe
User-level dynamic function return instrumentation
software
Kernel software-based events
hardware
Hardware counter-based instrumentation
watchpoint
Memory watchpoint events (in development)
profile
Timed sampling across all CPUs
interval
Timed reporting (from one CPU)
BEGIN
Start of bpftrace
END
End of bpftrace
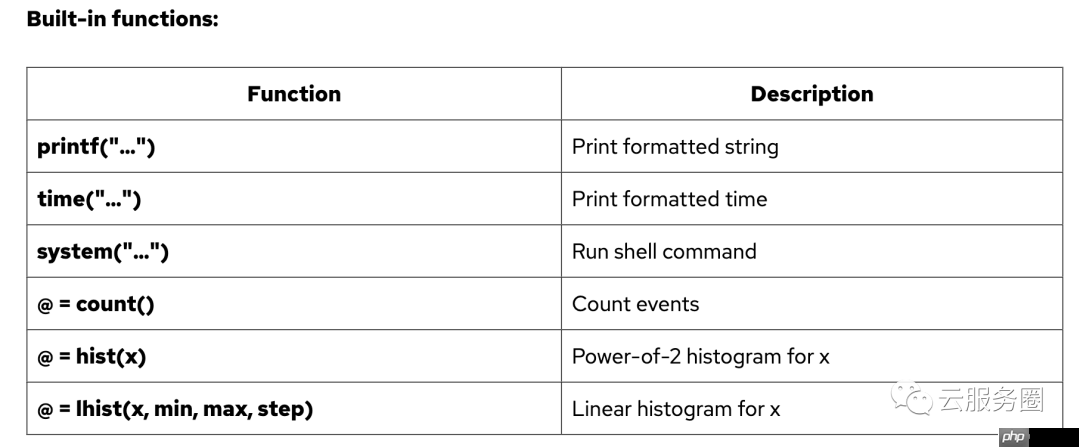
Listing probes
bpftrace -l 'tracepoint:syscalls:sys_enter_*'
Hello world
bpftrace -e 'BEGIN { printf("hello world\n") }'
File opens
bpftrace -e 'tracepoint:syscalls:sys_enter_open { printf("%s %s\n", comm, str(args->filename)) }'
Syscall counts by process
bpftrace -e 'tracepoint:raw_syscalls:sys_enter { @[comm] = count() }'
Distribution of read() bytes
bpftrace -e 'tracepoint:syscalls:sys_exit_read /pid == 18644/ { @bytes = hist(args->retval) }'
Kernel dynamic tracing of read() bytes
bpftrace -e 'kretprobe:vfs_read { @bytes = lhist(retval, 0, 2000, 200) }'
Timing read()s
bpftrace -e 'kprobe:vfs_read { @start[tid] = nsecs } kretprobe:vfs_read /@start[tid]/ { @ns[comm] = hist(nsecs - @start[tid]); delete(@start[tid]) }'
Count process-level events
bpftrace -e 'tracepoint:sched:sched* { @[name] = count() } interval:s:5 { exit() }'
Profile on-CPU kernel stacks
bpftrace -e 'profile:hz:99 { @[stack] = count() }'
Scheduler tracing
bpftrace -e 'tracepoint:sched:sched_switch { @[stack] = count() }'
Block I/O tracing
bpftrace -e 'tracepoint:block:block_rq_issue { @ = hist(args->bytes); }
Kernel struct tracing (a script, not a one-liner)
Command: bpftrace path.bt, where the path.bt file is:#include linux/path.h>#include
典型项目
https://github.com/heidsoft-linux/ciliumCilium is an open source project to provide networking, security, and observability for cloud native environments such as Kubernetes clusters and other container orchestration platforms.Cilium是一个开源项目,旨在为云原生环境(如Kubernetes集群和其他容器编排平台)提供网络,安全性和可观察性。At the foundation of Cilium is a new Linux kernel technology called eBPF, which enables the dynamic insertion of powerful security, visibility, and networking control logic into the Linux kernel. eBPF is used to provide high-performance networking, multi-cluster and multi-cloud capabilities, advanced load balancing, transparent encryption, extensive network security capabilities, transparent observability, and much more.Cilium 的基础是一种名为 eBPF 的新型 Linux 内核技术,它能够将强大的安全性、可见性和网络控制逻辑动态插入到 Linux 内核中。eBPF 用于提供高性能网络、多集群和多云功能、高级负载平衡、透明加密、广泛的网络安全功能、透明的可观察性等等。Cilium consists of an agent running on all cluster nodes and servers in your environment. It provides networking, security, and observability to the workloads running on that node. Workloads can be containerized or running natively on the system.Cilium 由在环境中的所有群集节点和服务器上运行的代理组成。它为该节点上运行的工作负荷提供网络、安全性和可观察性。工作负载可以在系统上进行容器化或本机运行。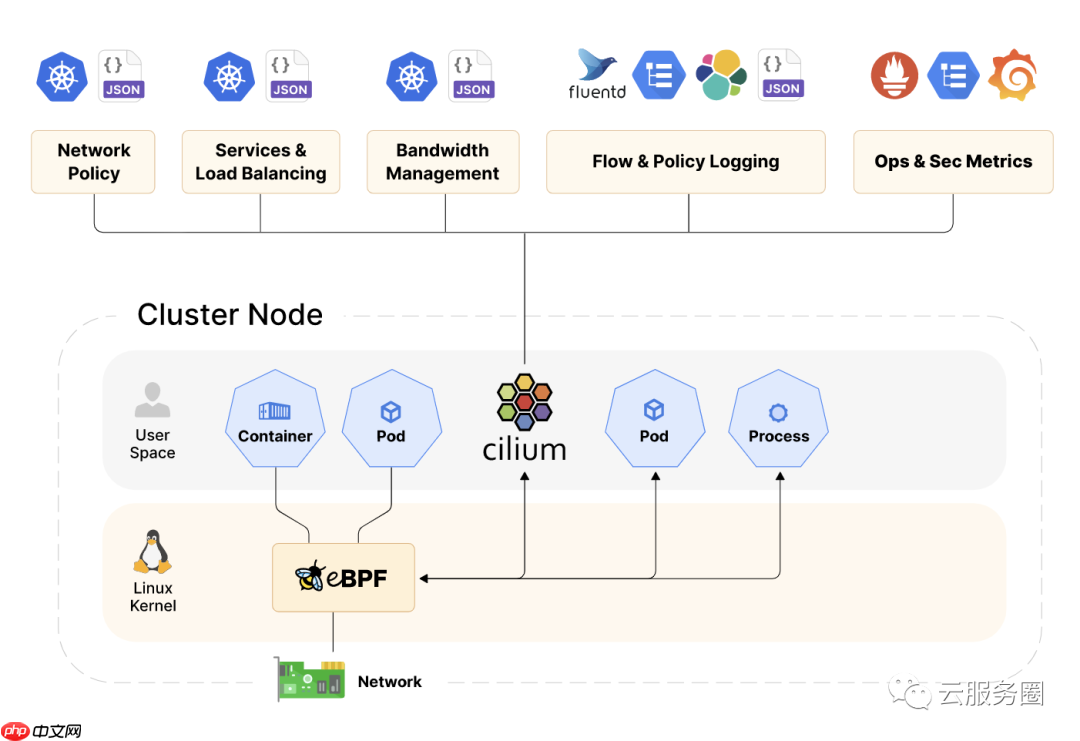
eBPF is a revolutionary technology with origins in the Linux kernel that can run sandboxed programs in an operating system kernel. It is used to safely and efficiently extend the capabilities of the kernel without requiring to change kernel source code or load kernel modules.
eBPF是一项革命性的技术,起源于Linux内核,可以在操作系统内核中运行沙盒程序。它用于安全有效地扩展内核的功能,而无需更改内核源代码或加载内核模块。
Historically, the operating system has always been an ideal place to implement observability, security, and networking functionality due to the kernel’s privileged ability to oversee and control the entire system. At the same time, an operating system kernel is hard to evolve due to its central role and high requirement towards stability and security. The rate of innovation at the operating system level has thus traditionally been lower compared to functionality implemented outside of the operating system.
从历史上看,由于内核具有监督和控制整个系统的特权能力,操作系统一直是实现可观察性,安全性和网络功能的理想场所。同时,操作系统内核由于其核心作用以及对稳定性和安全性的高要求而难以发展。因此,与在操作系统之外实现的功能相比,操作系统级别的创新率传统上较低。
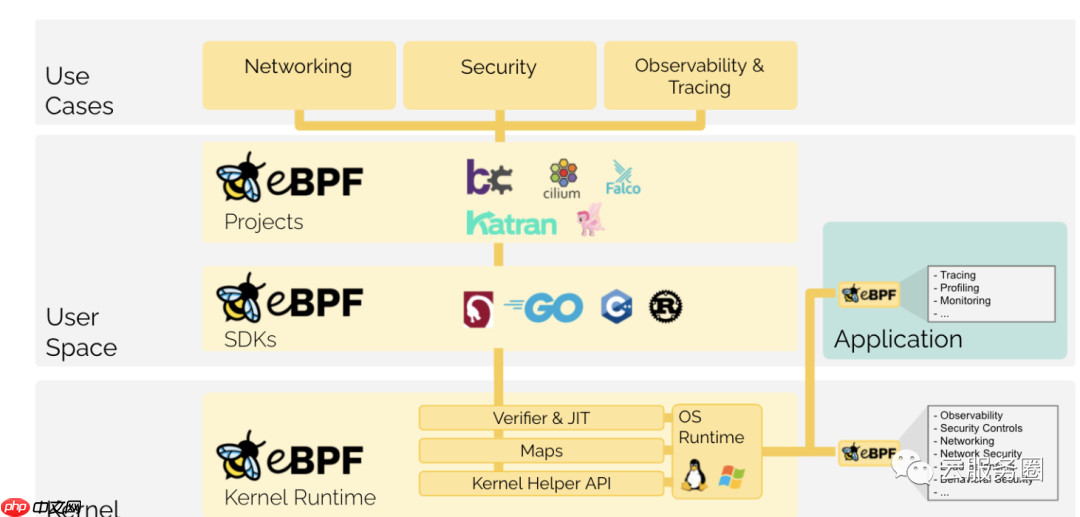
eBPF changes this formula fundamentally. By allowing to run sandboxed programs within the operating system, application developers can run eBPF programs to add additional capabilities to the operating system at runtime. The operating system then guarantees safety and execution efficiency as if natively compiled with the aid of a Just-In-Time (JIT) compiler and verification engine. This has led to a wave of eBPF-based projects covering a wide array of use cases, including next-generation networking, observability, and security functionality.
eBPF从根本上改变了这个公式。通过允许在操作系统中运行沙盒程序,应用程序开发人员可以运行 eBPF 程序,以便在运行时向操作系统添加其他功能。然后,操作系统保证安全性和执行效率,就像在实时(JIT)编译器和验证引擎的帮助下进行本机编译一样。这导致了一波基于eBPF的项目,涵盖了广泛的用例,包括下一代网络,可观察性和安全功能。
today, eBPF is used extensively to drive a wide variety of use cases: Providing high-performance networking and load-balancing in modern data centers and cloud native environments, extracting fine-grained security observability data at low overhead, helping application developers trace applications, providing insights for performance troubleshooting, preventive application and container runtime security enforcement, and much more. The possibilities are endless, and the innovation that eBPF is unlocked has only just begun.
如今,eBPF被广泛用于驱动各种用例:在现代数据中心和云原生环境中提供高性能网络和负载平衡,以低开销提取细粒度的安全可观察性数据,帮助应用程序开发人员跟踪应用程序,为性能故障排除、预防性应用程序和容器运行时安全实施提供见解等等。可能性是无穷无尽的,eBPF解锁的创新才刚刚开始。
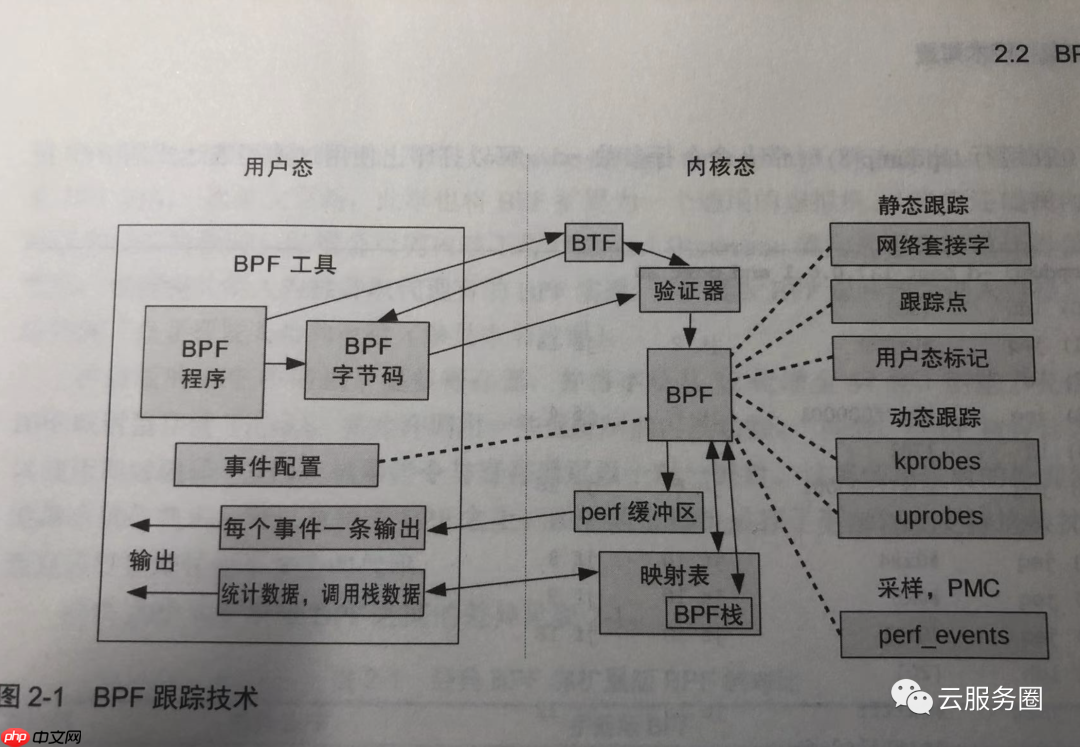
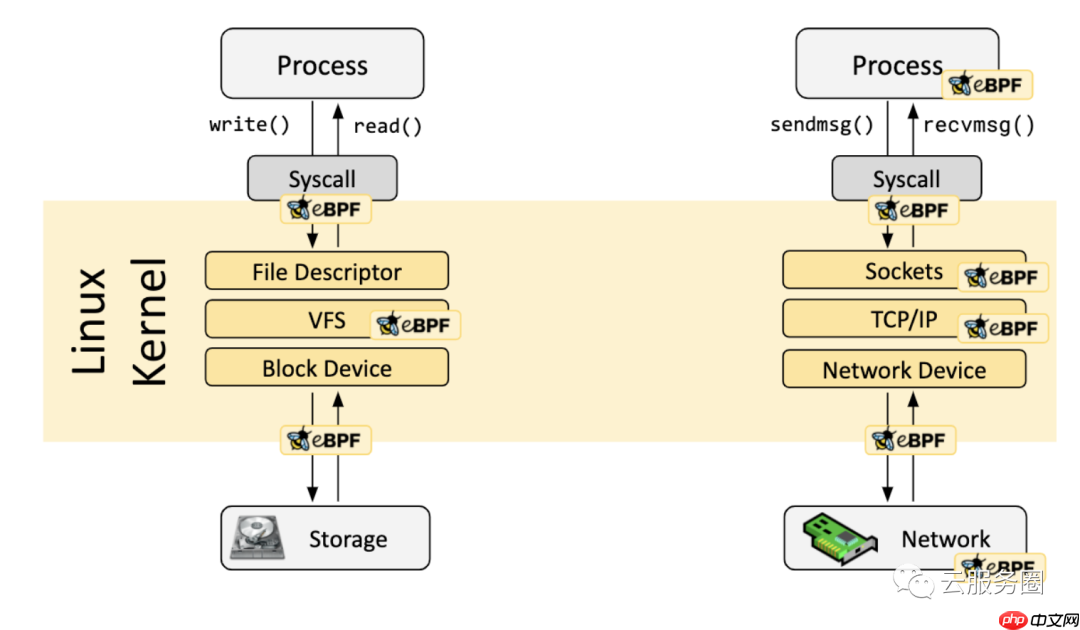
eBPF programs are event-driven and are run when the kernel or an application passes a certain hook point. Pre-defined hooks include system calls, function entry/exit, kernel tracepoints, network events, and several others.
eBPF 程序是事件驱动的,在内核或应用程序通过某个挂钩点时运行。预定义的挂钩包括系统调用、函数进入/退出、内核跟踪点、网络事件和其他几个。
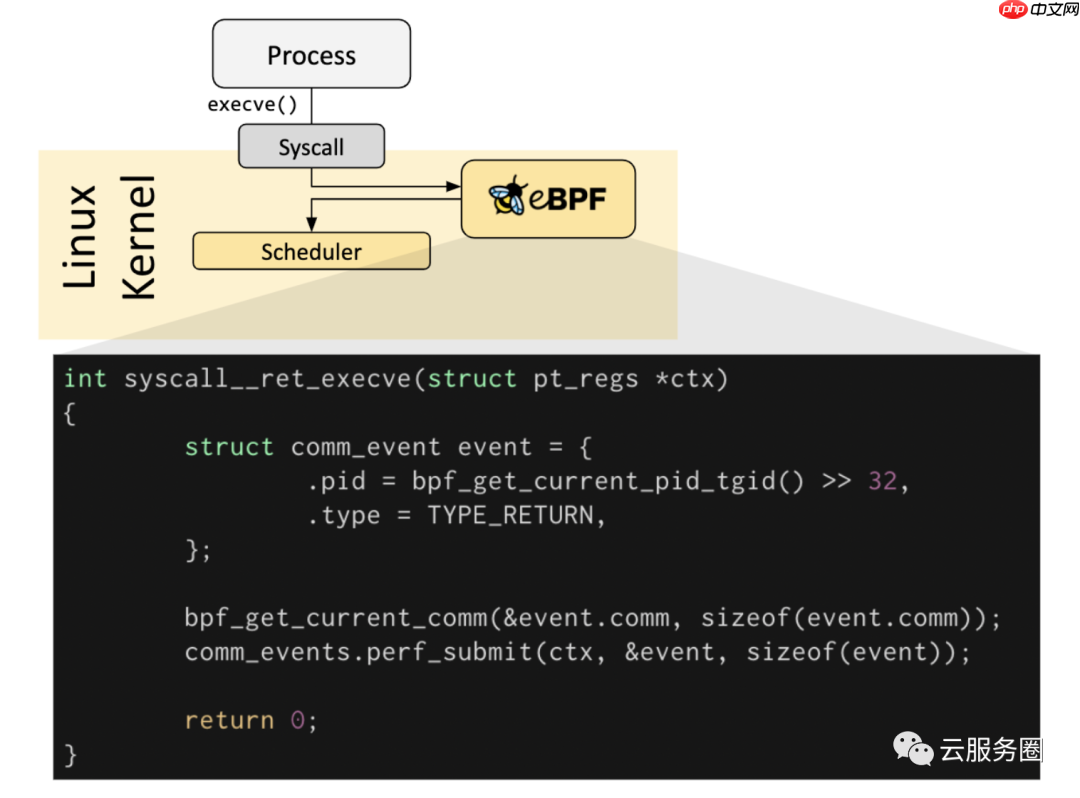
If a predefined hook does not exist for a particular need, it is possible to create a kernel probe (kprobe) or user probe (uprobe) to attach eBPF programs almost anywhere in kernel or user applications.
如果不存在针对特定需求的预定义钩子,则可以创建内核探测器(kprobe)或用户探测器(uprobe),以将eBPF程序附加到内核或用户应用程序中的几乎任何位置。
In a lot of scenarios, eBPF is not used directly but indirectly via projects like Cilium, bcc, or bpftrace which provide an abstraction on top of eBPF and do not require to write programs directly but instead offer the ability to specify intent-based definitions which are then implemented with eBPF.
在很多情况下,eBPF不是直接使用,而是通过Cilium,bcc或bpftrace等项目间接使用,这些项目在eBPF之上提供抽象,不需要直接编写程序,而是提供指定基于意图的定义的能力,然后使用eBPF实现。
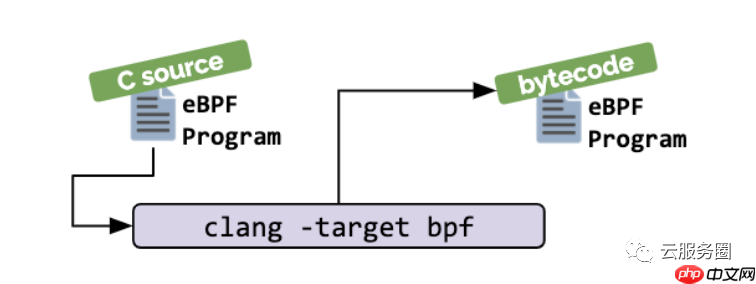
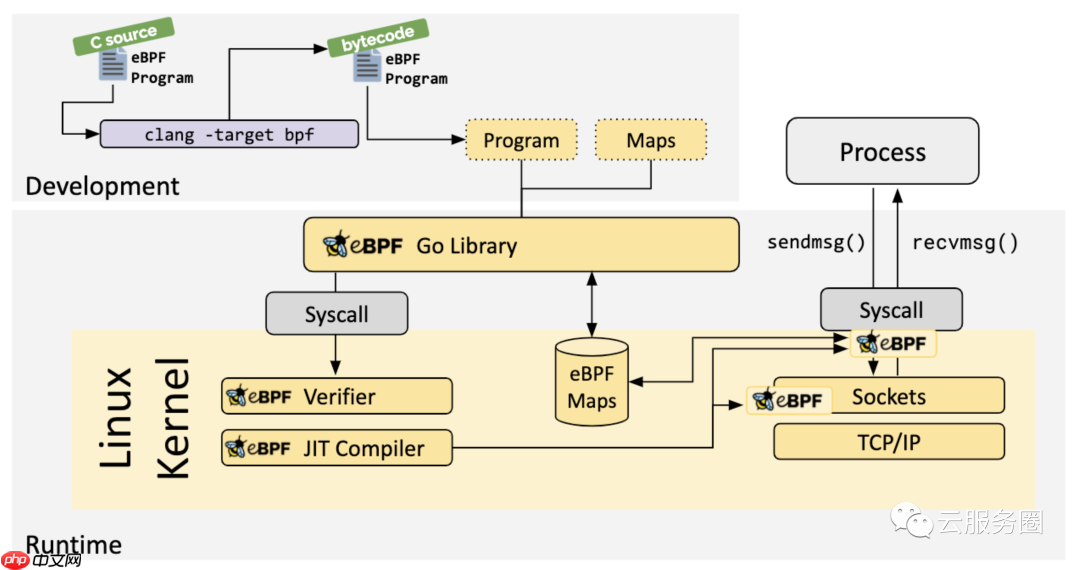
If no higher-level abstraction exists, programs need to be written directly. The Linux kernel expects eBPF programs to be loaded in the form of bytecode. While it is of course possible to write bytecode directly, the more common development practice is to leverage a compiler suite like LLVM to compile pseudo-C code into eBPF bytecode.
如果不存在更高级别的抽象,则需要直接编写程序。Linux内核期望eBPF程序以字节码的形式加载。虽然当然可以直接编写字节码,但更常见的开发实践是利用LLVM等编译器套件将伪C代码编译成eBPF字节码。
When the desired hook has been identified, the eBPF program can be loaded into the Linux kernel using the bpf system call. This is typically done using one of the available eBPF libraries. The next section provides an introduction into the available development toolchains.
当确定了所需的钩子时,可以使用 bpf 系统调用将 eBPF 程序加载到 Linux 内核中。这通常使用一个可用的 eBPF 库来完成。下一节将介绍可用的开发工具链。
As the program is loaded into the Linux kernel, it passes through two steps before being attached to the requested hook:
当程序被加载到 Linux 内核中时,它会在附加到请求的钩子之前经历两个步骤:
Verification 验证The verification step ensures that the eBPF program is safe to run. It validates that the program meets several conditions, for example:
验证步骤可确保 eBPF 程序安全运行。它验证程序是否满足多个条件,例如:

The Just-in-Time (JIT) compilation step translates the generic bytecode of the program into the machine specific instruction set to optimize execution speed of the program. This makes eBPF programs run as efficiently as natively compiled kernel code or as code loaded as a kernel module.
实时 (JIT) 编译步骤将程序的通用字节码转换为计算机特定的指令集,以优化程序的执行速度。这使得 eBPF 程序的运行效率与本机编译的内核代码或作为内核模块加载的代码一样高效。
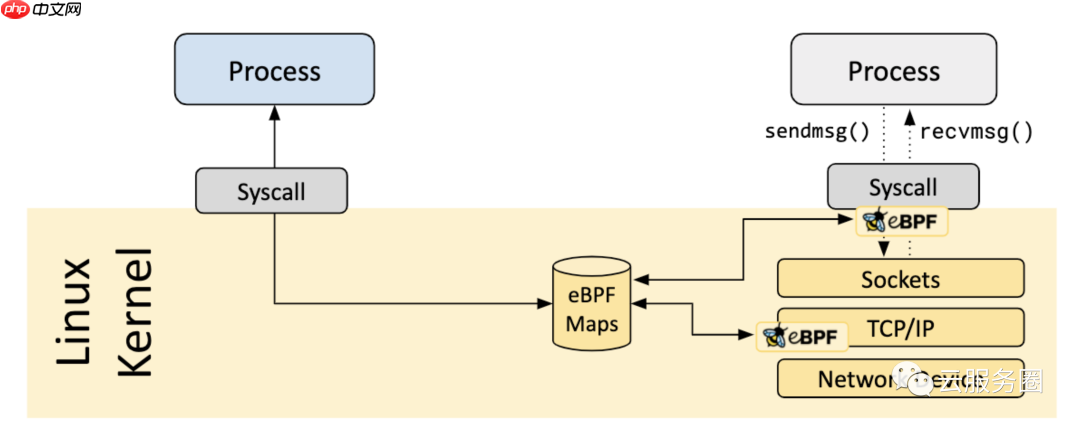
MapsA vital aspect of eBPF programs is the ability to share collected information and to store state. For this purpose, eBPF programs can leverage the concept of eBPF maps to store and retrieve data in a wide set of data structures. eBPF maps can be accessed from eBPF programs as well as from applications in user space via a system call.
eBPF程序的一个重要方面是能够共享收集的信息并存储状态。为此,eBPF程序可以利用eBPF映射的概念来存储和检索各种数据结构中的数据。eBPF地图可以通过系统调用从eBPF程序以及用户空间中的应用程序访问。
The following is an incomplete list of supported map types to give an understanding of the diversity in data structures. For various map types, both a shared and a per-CPU variation is available.
Hash tables, ArraysLRU (Least Recently Used)Ring BufferStack TraceLPM (Longest Prefix match)参考文献
https://github.com/iovisor/bpftrace/blob/master/docs/tutorial_one_liners.mdhttps://opensource.com/article/19/8/introduction-bpftracehttps://qmonnet.github.io/whirl-offload/2016/09/01/dive-into-bpf/https://cilium.io/blog/2018/11/20/fb-bpf-firewallhttps://ebpf.io/what-is-ebpf/https://blogs.oracle.com/linux/post/bpf-a-tour-of-program-typeshttps://ebpf.io/what-is-ebpf/以上就是bpf| 系统分析工具的详细内容,更多请关注php中文网其它相关文章!

每个人都需要一台速度更快、更稳定的 PC。随着时间的推移,垃圾文件、旧注册表数据和不必要的后台进程会占用资源并降低性能。幸运的是,许多工具可以让 Windows 保持平稳运行。

 广告
广告Copyright 2014-2025 https://www.php.cn/ All Rights Reserved | php.cn | 湘ICP备2023035733号


 410
410