这篇文章主要为大家详细介绍了python3+pyqt5实现柱状图的方法,具有一定的参考价值,感兴趣的小伙伴们可以参考一下
本文通过Python3+pyqt5实现了python Qt GUI 快速编程的16章的excise例子。
#!/usr/bin/env python3
import random
import sys
from PyQt5.QtCore import (QAbstractListModel, QAbstractTableModel,
QModelIndex, QSize, QTimer, QVariant, Qt,pyqtSignal)
from PyQt5.QtWidgets import (QApplication, QDialog, QHBoxLayout,
QListView, QSpinBox, QStyledItemDelegate,QStyleOptionViewItem, QWidget)
from PyQt5.QtGui import QColor,QPainter,QPixmap
class BarGraphModel(QAbstractListModel):
dataChanged=pyqtSignal(QModelIndex,QModelIndex)
def __init__(self):
super(BarGraphModel, self).__init__()
self.__data = []
self.__colors = {}
self.minValue = 0
self.maxValue = 0
def rowCount(self, index=QModelIndex()):
return len(self.__data)
def insertRows(self, row, count):
extra = row + count
if extra >= len(self.__data):
self.beginInsertRows(QModelIndex(), row, row + count - 1)
self.__data.extend([0] * (extra - len(self.__data) + 1))
self.endInsertRows()
return True
return False
def flags(self, index):
#return (QAbstractTableModel.flags(self, index)|Qt.ItemIsEditable)
return (QAbstractListModel.flags(self, index)|Qt.ItemIsEditable)
def setData(self, index, value, role=Qt.DisplayRole):
row = index.row()
if not index.isValid() or 0 > row >= len(self.__data):
return False
changed = False
if role == Qt.DisplayRole:
value = value
self.__data[row] = value
if self.minValue > value:
self.minValue = value
if self.maxValue < value:
self.maxValue = value
changed = True
elif role == Qt.UserRole:
self.__colors[row] = value
#self.emit(SIGNAL("dataChanged(QModelIndex,QModelIndex)"),
# index, index)
self.dataChanged[QModelIndex,QModelIndex].emit(index, index)
changed = True
if changed:
#self.emit(SIGNAL("dataChanged(QModelIndex,QModelIndex)"),
# index, index)
self.dataChanged[QModelIndex,QModelIndex].emit(index, index)
return changed
def data(self, index, role=Qt.DisplayRole):
row = index.row()
if not index.isValid() or 0 > row >= len(self.__data):
return QVariant()
if role == Qt.DisplayRole:
return self.__data[row]
if role == Qt.UserRole:
return QVariant(self.__colors.get(row,
QColor(Qt.red)))
if role == Qt.DecorationRole:
color = QColor(self.__colors.get(row,
QColor(Qt.red)))
pixmap = QPixmap(20, 20)
pixmap.fill(color)
return QVariant(pixmap)
return QVariant()
class BarGraphDelegate(QStyledItemDelegate):
def __init__(self, minimum=0, maximum=100, parent=None):
super(BarGraphDelegate, self).__init__(parent)
self.minimum = minimum
self.maximum = maximum
def paint(self, painter, option, index):
myoption = QStyleOptionViewItem(option)
myoption.displayAlignment |= (Qt.AlignRight|Qt.AlignVCenter)
QStyledItemDelegate.paint(self, painter, myoption, index)
def createEditor(self, parent, option, index):
spinbox = QSpinBox(parent)
spinbox.setRange(self.minimum, self.maximum)
spinbox.setAlignment(Qt.AlignRight|Qt.AlignVCenter)
return spinbox
def setEditorData(self, editor, index):
value = index.model().data(index, Qt.DisplayRole)
editor.setValue(value)
def setModelData(self, editor, model, index):
editor.interpretText()
model.setData(index, editor.value())
class BarGraphView(QWidget):
WIDTH = 20
def __init__(self, parent=None):
super(BarGraphView, self).__init__(parent)
self.model = None
def setModel(self, model):
self.model = model
#self.connect(self.model,
# SIGNAL("dataChanged(QModelIndex,QModelIndex)"),
# self.update)
self.model.dataChanged[QModelIndex,QModelIndex].connect(self.update)
#self.connect(self.model, SIGNAL("modelReset()"), self.update)
self.model.modelReset.connect(self.update)
def sizeHint(self):
return self.minimumSizeHint()
def minimumSizeHint(self):
if self.model is None:
return QSize(BarGraphView.WIDTH * 10, 100)
return QSize(BarGraphView.WIDTH * self.model.rowCount(), 100)
def paintEvent(self, event):
if self.model is None:
return
painter = QPainter(self)
painter.setRenderHint(QPainter.Antialiasing)
span = self.model.maxValue - self.model.minValue
painter.setWindow(0, 0, BarGraphView.WIDTH * self.model.rowCount(),
span)
for row in range(self.model.rowCount()):
x = row * BarGraphView.WIDTH
index = self.model.index(row)
color = QColor(self.model.data(index, Qt.UserRole))
y = self.model.data(index)
painter.fillRect(x, span - y, BarGraphView.WIDTH, y, color)
class MainForm(QDialog):
def __init__(self, parent=None):
super(MainForm, self).__init__(parent)
self.model = BarGraphModel()
self.barGraphView = BarGraphView()
self.barGraphView.setModel(self.model)
self.listView = QListView()
self.listView.setModel(self.model)
self.listView.setItemDelegate(BarGraphDelegate(0, 1000, self))
self.listView.setMaximumWidth(100)
self.listView.setEditTriggers(QListView.DoubleClicked|
QListView.EditKeyPressed)
layout = QHBoxLayout()
layout.addWidget(self.listView)
layout.addWidget(self.barGraphView, 1)
self.setLayout(layout)
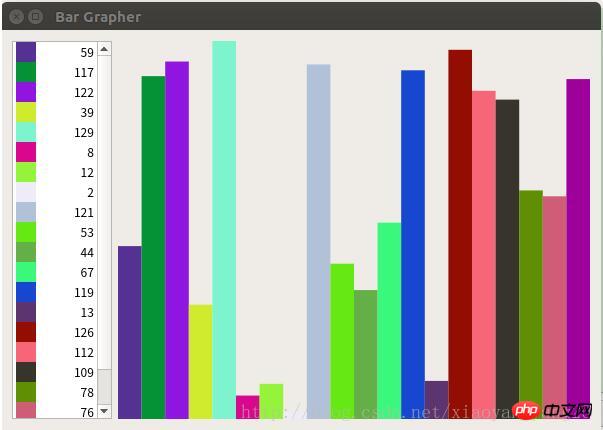
self.setWindowTitle("Bar Grapher")
QTimer.singleShot(0, self.initialLoad)
def initialLoad(self):
# Generate fake data
count = 20
self.model.insertRows(0, count - 1)
for row in range(count):
value = random.randint(1, 150)
color = QColor(random.randint(0, 255), random.randint(0, 255),
random.randint(0, 255))
index = self.model.index(row)
self.model.setData(index, value)
self.model.setData(index, QVariant(color), Qt.UserRole)
app = QApplication(sys.argv)
form = MainForm()
form.resize(600, 400)
form.show()
app.exec_()运行结果:
相关推荐:
立即学习“Python免费学习笔记(深入)”;
以上就是python3+PyQt5实现柱状图的详细内容,更多请关注php中文网其它相关文章!

python怎么学习?python怎么入门?python在哪学?python怎么学才快?不用担心,这里为大家提供了python速学教程(入门到精通),有需要的小伙伴保存下载就能学习啦!

Copyright 2014-2025 https://www.php.cn/ All Rights Reserved | php.cn | 湘ICP备2023035733号


 329
329