时间序列是一系列在固定时间间隔记录的数据点。它用于研究模式的趋势、变量之间的关系以及定义的时间内的变化。时间序列的常见例子包括股票价格、天气模式和经济指标。
通过统计和数学技术对时间序列数据进行分析。时间序列的主要目的是识别先前数据的模式和趋势,以预测未来的值。
The data is said to be stationary, if it doesn’t change with the time. It is necessary to check if the data is stationary or not. There are different ways to check if time series data is stationary, let’s see them one by one.
Augmented Dickey-Fuller(ADF) is a statistical test which checks for the presence of the unit roots available in the time series data. The unit root is the data which is non stationary. It returns the test static and p value as the output.
在输出中,如果p值低于0.05,则表示非平稳时间序列数据。以下是ADF平稳数据的示例。我们在Python中有一个名为adfuller()的函数,它在statsmodel 包中可用于检查时间序列数据是否平稳。
立即学习“Python免费学习笔记(深入)”;
In this example we are finding the ADF statistic and p-value of the Augmented Dickey Fuller using the adfuller() function of the statsmodel package of python.
from statsmodels.tsa.stattools import adfuller
import pandas as pd
data = pd.read_csv('https://raw.githubusercontent.com/selva86/datasets/master/a10.csv',parse_dates=['date'], index_col='date')
t_data = data.loc[:, 'value'].values
result = adfuller(t_data)
print("The result of adfuller function:",result)
print('ADF Statistic:', result[0])
print('p-value:', result[1])
Following is the output produced after executing the program above –
The result of adfuller function: (3.145185689306744, 1.0, 15, 188, {'1%': -3.465620397124192, '5%': -2.8770397560752436, '10%': -2.5750324547306476}, 549.6705685364172)
ADF Statistic: 3.145185689306744
p-value: 1.0
检查单位根的另一种测试是KPSS测试。它的缩写是Kwiatkowski-Phillips-Schmidt-Shin。我们在statsmodels包中有一个名为kpss()的函数,用于检查时间序列数据中的单位根。
下面是一个在时间序列数据中寻找单位根的示例。
from statsmodels.tsa.stattools import kpss
import pandas as pd
data = pd.read_csv('https://raw.githubusercontent.com/selva86/datasets/master/a10.csv',parse_dates=['date'], index_col='date')
t_data = data.loc[:, 'value'].values
from statsmodels.tsa.stattools import kpss
result = kpss(data)
print("The result of kpss function:",result)
print('KPSS Statistic:', result[0])
print('p-value:', result[1])
以下是statsmodels包中kpss()函数的输出结果。
The result of kpss function: (2.0131256386303322, 0.01, 9, {'10%': 0.347, '5%': 0.463, '2.5%': 0.574, '1%': 0.739})
KPSS Statistic: 2.0131256386303322
p-value: 0.01
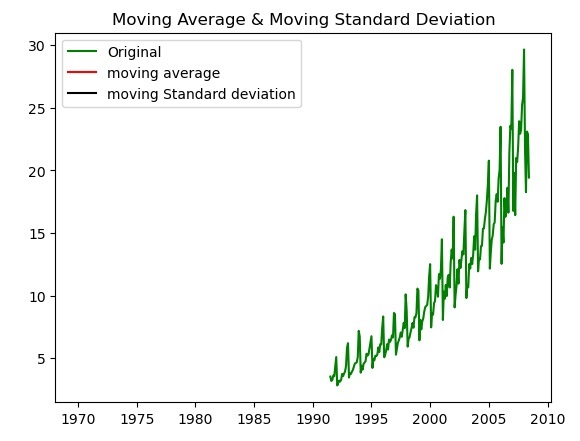
检查时间序列数据的另一种方法是绘制给定时间序列数据的移动平均值和移动标准差,并检查数据是否保持恒定。如果在图表中数据随时间变化,则时间序列数据是非平稳的。
The following is the example for checking the data variation by plotting the moving average and moving standard deviation using the matplotlib library plot() function.
import pandas as pd
import matplotlib.pyplot as plt
data = pd.read_csv('https://raw.githubusercontent.com/selva86/datasets/master/a10.csv',parse_dates=['date'], index_col='date')
t_data = data.loc[:, 'value'].values
moving_avg = t_data.mean()
moving_std = t_data.std()
plt.plot(data, color='green', label='Original')
plt.plot(moving_avg, color='red', label='moving average')
plt.plot(moving_std, color='black', label='moving Standard deviation')
plt.legend(loc='best')
plt.title('Moving Average & Moving Standard Deviation')
plt.show()
以下是通过绘制移动平均值和移动标准差对时间序列数据进行标准化的输出。
以上就是如何使用Python检查时间序列数据是否是平稳的?的详细内容,更多请关注php中文网其它相关文章!

python怎么学习?python怎么入门?python在哪学?python怎么学才快?不用担心,这里为大家提供了python速学教程(入门到精通),有需要的小伙伴保存下载就能学习啦!

 广告
广告Copyright 2014-2025 https://www.php.cn/ All Rights Reserved | php.cn | 湘ICP备2023035733号


 137
137