本文基于ResNet50实现教师课堂情绪识别,介绍了ResNet50的残差连接、残差块等核心结构。使用含7类情绪的48x48灰度图像数据集,经预处理后搭建模型,通过训练、评估优化,最终实现情绪预测,为增强师生情感联系提供技术支持。
☞☞☞AI 智能聊天, 问答助手, AI 智能搜索, 免费无限量使用 DeepSeek R1 模型☜☜☜

基于ResNet50 实现教师课堂情绪识别
一、背景介绍
在教育的旅程中,教师不仅是知识的传递者,更是情感的引导者。他们通过言语和表情,传递着鼓励、关怀和激励,这些非言语的交流方式对学生的成长有着深远的影响。随着人工智能技术的发展,面部表情识别技术为我们提供了一种新的视角,去理解和回应教师的情感表达。
马上到来的教师节这个特殊的日子,我们希望通过技术的力量,让学生们能够更加直观地感受到教师的情感世界,同时也为教师提供一个展示他们情感表达的平台。通过面部表情识别技术,我们能够捕捉到教师在教学过程中的微妙表情变化,并将这些变化转化为可以互动的数据,从而增强教师与学生之间的情感联系。
二、ResNet50介绍
ResNet50是一种基于深度卷积神经网络(Convolutional Neural Network,CNN)的图像分类算法。它是由微软研究院的Kaiming He等人于2015年提出的,是ResNet系列中的一个重要成员。ResNet50相比于传统的CNN模型具有更深的网络结构,通过引入残差连接(residual connection)解决了深层网络训练过程中的梯度消失问题,有效提升了模型的性能。
深度卷积神经网络(CNN) CNN是一种专门用于图像处理的神经网络结构,具有层次化的特征提取能力。它通过交替使用卷积层、池化层和激活函数层,逐层地提取图像的特征,从而实现对图像的分类、检测等任务。然而,当网络结构变得非常深时,CNN模型容易面临梯度消失和模型退化的问题。
残差连接(Residual Connection) 残差连接是ResNet50的核心思想之一。在传统的CNN模型中,网络层之间的信息流是依次通过前一层到后一层,而且每一层的输出都需要经过激活函数处理。这种顺序传递信息的方式容易导致梯度消失的问题,尤其是在深层网络中。ResNet50通过在网络中引入残差连接,允许信息在网络层之间直接跳跃传递,从而解决了梯度消失的问题。
残差块(Residual Block) ResNet50中的基本构建块是残差块。每个残差块由两个卷积层组成,这两个卷积层分别称为主路径(main path)和跳跃连接(shortcut connection)。主路径中的卷积层用于提取特征,而跳跃连接直接将输入信息传递到主路径的输出上。通过将输入与主路径的输出相加,实现了信息的残差学习。此外,每个残差块中还使用批量归一化(Batch Normalization)和激活函数(如ReLU)来进一步提升模型的性能。
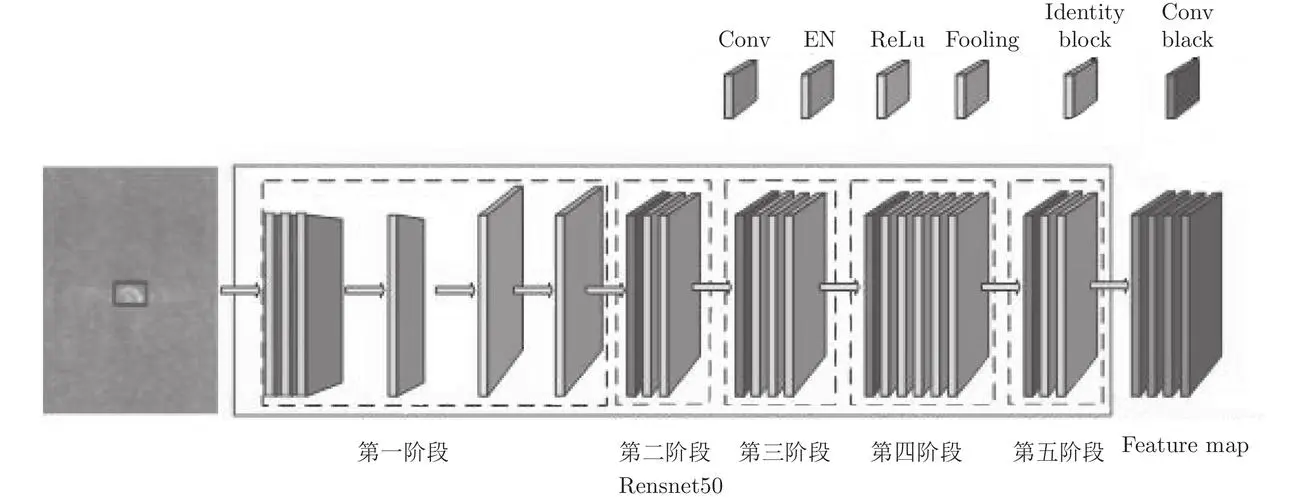
ResNet50网络结构 ResNet50网络由多个残差块组成,其中包括了一些附加的层,如池化层和全连接层。整个网络的结构非常深,并且具有很强的特征提取能力。在ResNet50中,使用了50个卷积层,因此得名ResNet50。这些卷积层以不同的尺寸和深度对图像进行特征提取,使得模型能够捕捉到不同层次的特征。
三、模型结构
ResNet50的结构可以分为五个阶段:1x1卷积层、3x3卷积层、池化层、全连接层和分类器。 ResNet50的输入图像经过一个7x7的卷积层,步长为2,输出通道数为64,然后经过一个步长为2的池化层,将图像大小减小为原来的1/4。 接下来,图像通过四个阶段的残差块。每个残差块由若干个3x3的卷积层组成,每个卷积层后跟着一个批归一化层和ReLU激活函数。在每个阶段的第一个残差块中,由于图像尺寸的改变,需要使用一个1x1的卷积层来调整通道数和图像尺寸。每个阶段的残差块的通道数会逐渐增加,同时图像的尺寸会减小。 在经过四个阶段的残差块后,图像通过一个平均池化层,将图像大小减小为1x1。然后,将图像展平,并通过一个全连接层进行特征提取。 通过一个分类器,将图像分为不同的类别。分类器使用一个全连接层和一个softmax函数,将特征映射到不同的类别上。
四、模型训练和预测
4.1、数据集解压
!unzip -oq /home/aistudio/data/data293302/emoji.zip -d /home/aistudio/work
# 查看图片的数据量import osdef count_images(directory):
    # 支持的图片文件扩展名列表
    image_extensions = ['.jpg', '.jpeg', '.png', '.gif', '.bmp', '.tiff']    # 遍历目录中的所有子文件夹
    for folder in os.listdir(directory):
        folder_path = os.path.join(directory, folder)        if os.path.isdir(folder_path):            # 统计当前文件夹中的图片数量
            image_count = sum([1 for file in os.listdir(folder_path) if os.path.splitext(file)[1].lower() in image_extensions])            print(f"{folder}: {image_count} images")

directory_path = '/home/aistudio/work/emoji'count_images(directory_path)
angry: 4953 images
happy: 8989 images
fear: 5121 images
sad: 6077 images
disgust: 547 images
neutral: 6197 images
surprise: 4002 images
# 查看图片的宽高和通道import osfrom PIL import Imagedef get_first_image_shape(directory):
    # 支持的图片文件扩展名列表
    image_extensions = ['.jpg', '.jpeg', '.png', '.gif', '.bmp', '.tiff']    # 遍历目录中的所有子文件夹
    for folder in os.listdir(directory):
        folder_path = os.path.join(directory, folder)        if os.path.isdir(folder_path):            # 遍历文件夹中的文件,找到第一个图片文件
            for file in os.listdir(folder_path):                if os.path.splitext(file)[1].lower() in image_extensions:
                    image_path = os.path.join(folder_path, file)                    try:                        with Image.open(image_path) as img:
                            width, height = img.size
                            mode = img.mode
                            channels = 1 if mode == 'L' else 3 if mode in ('RGB', 'P') else 4 if mode == 'RGBA' else 'Unknown'
                            print(f"{folder}: {width}x{height}, Channels: {channels}")                        break  # 找到第一个图片后停止搜索
                    except Exception as e:                        print(f"Error opening {image_path}: {e}")                        break  # 如果无法打开图片,也停止搜索# 替换为你的文件夹路径directory_path = '/home/aistudio/work/emoji'get_first_image_shape(directory_path)
angry: 48x48, Channels: 1
happy: 48x48, Channels: 1
fear: 48x48, Channels: 1
sad: 48x48, Channels: 1
disgust: 48x48, Channels: 1
neutral: 48x48, Channels: 1
surprise: 48x48, Channels: 1
4.2、数据预处理
#导入相关库import numpy as np
import paddlefrom paddle.io import DataLoaderfrom paddle.vision.models import resnet50,resnet18,resnetfrom paddle.vision import transformsfrom PIL import Imagefrom paddle.io import Subsetimport matplotlib.pyplot as pltimport randomimport osfrom paddle.vision.transforms import Compose, RandomRotation, Resize, ToTensor, Normalizefrom paddle import nnfrom paddle import optimizerfrom paddle.vision.datasets import DatasetFolder
# 数据预处理transform = transforms.Compose([
    transforms.RandomRotation(20),
    transforms.Resize((48, 48)),
    transforms.ToTensor(),
    transforms.Normalize(mean=(0.5,), std=(0.5,))
])
train_data_path = "/home/aistudio/work/emoji"train_data = DatasetFolder(root=train_data_path,transform=transform)
#查看labeltrain_data.class_to_idx
{'angry': 0,
 'disgust': 1,
 'fear': 2,
 'happy': 3,
 'neutral': 4,
 'sad': 5,
 'surprise': 6}
#划分train数据集和train_val数据集batch_size = 64val_fraction = 0.3data_size = len(train_data)
val_split = int(np.floor(data_size * val_fraction))
indices = list(range(data_size))

np.random.seed(42)
np.random.shuffle(indices)

val_indices, train_indices = indices[:val_split], indices[val_split:]

train_sampler = paddle.io.Subset(train_data, train_indices)
val_sampler = paddle.io.Subset(train_data,val_indices)#读取数据集train_loader = DataLoader(
    dataset=train_sampler,
    batch_size=batch_size,
)

val_loader = DataLoader(
    dataset=val_sampler,
    batch_size=batch_size,
)
4.3、数据可视化
i = 0fig = plt.figure(figsize=(15, 3))for image, label in val_loader:    if i == 7: break

    ax = fig.add_subplot(1, 7, i+1)
    plt.imshow(image[1].transpose((1, 2, 0)))
    if(label[0] == 0):
        plt.title('Angry')    elif(label[0] == 1):
        plt.title('disgust')    elif(label[0] == 2):
        plt.title('fear')    elif(label[0] == 3):
        plt.title('happy')    elif(label[0] == 4):
        plt.title('neutral')    elif(label[0] == 5):
        plt.title('sad')    elif(label[0] == 6):
        plt.title('surprise')
    i += 1
    plt.axis('off')
plt.show()
W0906 18:06:42.864328  1650 gpu_resources.cc:61] Please NOTE: device: 0, GPU Compute Capability: 7.0, Driver API Version: 12.0, Runtime API Version: 11.2
W0906 18:06:42.868799  1650 gpu_resources.cc:91] device: 0, cuDNN Version: 8.2.
/opt/conda/envs/python35-paddle120-env/lib/python3.7/site-packages/matplotlib/cbook/__init__.py:2349: DeprecationWarning: Using or importing the ABCs from 'collections' instead of from 'collections.abc' is deprecated, and in 3.8 it will stop working
  if isinstance(obj, collections.Iterator):
/opt/conda/envs/python35-paddle120-env/lib/python3.7/site-packages/matplotlib/cbook/__init__.py:2366: DeprecationWarning: Using or importing the ABCs from 'collections' instead of from 'collections.abc' is deprecated, and in 3.8 it will stop working
  return list(data) if isinstance(data, collections.MappingView) else data
Clipping input data to the valid range for imshow with RGB data ([0..1] for floats or [0..255] for integers).
Clipping input data to the valid range for imshow with RGB data ([0..1] for floats or [0..255] for integers).
Clipping input data to the valid range for imshow with RGB data ([0..1] for floats or [0..255] for integers).
Clipping input data to the valid range for imshow with RGB data ([0..1] for floats or [0..255] for integers).
Clipping input data to the valid range for imshow with RGB data ([0..1] for floats or [0..255] for integers).
Clipping input data to the valid range for imshow with RGB data ([0..1] for floats or [0..255] for integers).
Clipping input data to the valid range for imshow with RGB data ([0..1] for floats or [0..255] for integers).
4.4、搭建模型
model = resnet50(pretrained=True,num_classes=7)
criterion = nn.CrossEntropyLoss()
optimizer = optimizer.Adam(learning_rate=1e-3,parameters=model.parameters(), weight_decay=1e-5)
100%|██████████| 151272/151272 [00:02<00:00, 68965.85it/s]
/opt/conda/envs/python35-paddle120-env/lib/python3.7/site-packages/paddle/fluid/dygraph/layers.py:1517: UserWarning: Skip loading for fc.weight. fc.weight receives a shape [2048, 1000], but the expected shape is [2048, 7].
  warnings.warn(("Skip loading for {}. ".format(key) + str(err)))
/opt/conda/envs/python35-paddle120-env/lib/python3.7/site-packages/paddle/fluid/dygraph/layers.py:1517: UserWarning: Skip loading for fc.bias. fc.bias receives a shape [1000], but the expected shape is [7].
  warnings.warn(("Skip loading for {}. ".format(key) + str(err)))
4.5、模型训练
# 模型训练def train_model(model, train_loader, val_loader, optimizer, criterion, num_epochs):
    train_history = []
    val_history = []
    train_loss_history = []
    val_loss_history = []
    for epoch in range(num_epochs):
        model.train()

        running_loss = 0.0
        correct_samples = 0
        total_samples = 0

        for idx, (X, y) in enumerate(train_loader):
            predictions = model(X)
            loss = criterion(predictions, y)

            optimizer.clear_grad()
            loss.backward()
            optimizer.step()

            indices = paddle.argmax(predictions, 1)
            correct_samples += paddle.sum(indices == y)
            total_samples += y.shape[0]

            running_loss += loss

        train_accuracy = float(correct_samples) / total_samples
        val_accuracy, val_loss = evaluate_model(model, val_loader, criterion)
        ave_loss = running_loss / (idx + 1)

        train_loss_history.append(float(ave_loss))
        val_loss_history.append(float(val_loss))
        train_history.append(train_accuracy)
        val_history.append(val_accuracy)        if epoch >= 80:
            paddle.save(model.state_dict(), '/home/aistudio/work/model/acc{}.model'.format(val_accuracy))
        print("Train loss: %f, Val loss: %f, Train accuracy: %f, Val accuracy: %f" % (ave_loss, val_loss, train_accuracy, val_accuracy))
    return train_loss_history, val_loss_history, train_history, val_history
# 模型评估def evaluate_model(model, loader, criterion):
    with paddle.no_grad():
        model.eval()

        correct_samples = 0
        total_samples = 0
        running_loss = 0.0

        for idx, (X, y) in enumerate(loader):

            predictions = model(X)
            loss = criterion(predictions, y)

            indices = paddle.argmax(predictions, 1)
            correct_samples += paddle.sum(indices == y)
            total_samples += y.shape[0]

            running_loss += loss

        accuracy = float(correct_samples) / total_samples
        ave_loss = running_loss / (idx + 1)        return accuracy, ave_loss
train_loss_history, val_loss_history, train_history, val_history = train_model(model, train_loader, val_loader, optimizer, criterion,100)
# 训练结果可视化(这里由于训练的数据集和训练轮数,导致效果并不是很好)plt.xlabel("Epoch")
plt.ylabel("Accuracy")
plt.plot(train_history)
plt.plot(val_history)
plt.show()

plt.xlabel("Epoch")
plt.ylabel("Loss")
plt.plot(train_loss_history)
plt.plot(val_loss_history)
plt.show()
4.6、模型预测,将结果可视化
def show_image_with_labels(image, y_true, y_pred):
    plt.figure(figsize=(15, 7))
    image = paddle.transpose(image, perm=[1, 2,0])
    plt.imshow(image)    if(y_true == 0):
        plt.title(f'Predicted  emotion: Angry')    elif(y_true == 1):
        plt.title(f'Predicted  emotion: disgust')    elif(y_true == 2):
        plt.title(f'Predicted  emotion: fear')    elif(y_true == 3):
        plt.title(f'Predicted  emotion: Happy')    elif(y_true == 4):
        plt.title(f'Predicted  emotion: neutral')    elif(y_true == 5):
        plt.title(f'Predicted  emotion: sad')    elif(y_true == 6):
        plt.title(f'Predicted  emotion: surprise')
    plt.axis('off')
    plt.show()
batch_images, batch_labels = next(iter(val_loader))with paddle.no_grad():
    model.eval()    for idx, image in enumerate(batch_images):        if idx == 7: break

        image_inference = image.unsqueeze(0)
        label_inference = batch_labels[idx]

        output = model(image_inference)

        y_pred = np.argmax(paddle.Tensor.cpu(output).numpy(), axis=1)[0]

        show_image_with_labels(image, y_pred, batch_labels[idx])
Clipping input data to the valid range for imshow with RGB data ([0..1] for floats or [0..255] for integers).
Clipping input data to the valid range for imshow with RGB data ([0..1] for floats or [0..255] for integers).
Clipping input data to the valid range for imshow with RGB data ([0..1] for floats or [0..255] for integers).
Clipping input data to the valid range for imshow with RGB data ([0..1] for floats or [0..255] for integers).
Clipping input data to the valid range for imshow with RGB data ([0..1] for floats or [0..255] for integers).
Clipping input data to the valid range for imshow with RGB data ([0..1] for floats or [0..255] for integers).
Clipping input data to the valid range for imshow with RGB data ([0..1] for floats or [0..255] for integers).
!pip install python-opencv
# 模型推理import cv2import matplotlib.pyplot as plt
labels={    0:'anger',    1:'disgust',    2:'happy',    3:'fear',    4:'neutral',    5:'sad',    6:'surprise'}# 加载训练好的模型pre_model = paddle.vision.models.resnet50(pretrained=True, num_classes=7)
pre_model.set_state_dict(paddle.load('/home/aistudio/work/model/acc0.5974363737692736.model'))
pre_model.eval()

test_path = "/home/aistudio/test"# 生成预测结果for path_1 in os.listdir(test_path):

    image_path = os.path.join(test_path, path_1)    if path_1.endswith(".jpg"):

        image = np.array(Image.open(image_path))    # H, W, C
        try:
            image = image.transpose([2, 0, 1])[:3]  # C, H, W
        except:
            image = np.array([image, image, image]) # C, H, W

        # 加载一张图片并进行预处理
        imge=cv2.imread(image_path)
        imge=cv2.cvtColor(imge,cv2.COLOR_BGR2RGB)
        input_tensor=transforms.to_tensor(imge, data_format='CHW')
        input_tensor=paddle.unsqueeze(input_tensor,axis=0)  #c,h,w

        # 推理图片获取识别结果
        pre = list(np.array(pre_model(input_tensor)[0]))
        max_item = max(pre)
        pre = pre.index(max_item)        # 展示图片和预测结果
        plt.figure()
        plt.title('predict: {}'.format(labels[int(pre)]))
        plt.imshow(imge)
        plt.show()


