本项目针对植物病虫害人工识别效率低、易误判问题,采用EfficientNet模型,并融入CBAM注意力模块以增强特征识别。通过处理数据集、划分训练测试集,经20轮训练后,含CBAM的模型准确率达95.58%,高于原模型的93.17%,虽提升了识别能力,但计算量增加,后续需优化以平衡精度与计算成本。
☞☞☞AI 智能聊天, 问答助手, AI 智能搜索, 免费无限量使用 DeepSeek R1 模型☜☜☜

一、项目背景
针对我国目前大量对于植物病虫害还处于人工识别阶段,这样不仅效率低下,还时常可能因为判断错误而使用错误方法造成没能对植物做到有效的治理,植物病虫害是影响农林业生产安全、生物安全和生态安全的严重生物灾害,是国际社会面临的共同挑战。植物病虫害生物学国家重点实验室针对国家农业生产和科学技术发展的重大需求,重点围绕植物病虫害基础生物学、暴发成灾机理,以及防控基础问题,开展前沿性、创造性和前瞻性研究,培养造就植物保护高层次人才,开展国际国内学术交流,努力建成我国植物保护科学的自主创新中心、国际交流中心、优秀科学家聚集地和高级人才培养基地,为我国农林业可持续发展、粮食安全、生态环境安全和经济安全服务,并在国际相关科学技术研究领域占居重要地位。现提出此项目,以提高病虫害识别能力。
二、模型概述
1.Efficientnet
卷积神经网络(ConvNets)通常是在固定的资源预算下发展起来的,如果有更多的资源可用的话,则会扩大规模以获得更好的精度,比如可以提高网络深度(depth)、网络宽度(width)和输入图像分辨率 (resolution)大小。但是通过人工去调整 depth, width, resolution 的放大或缩小的很困难的,在计算量受限时有放大哪个缩小哪个,这些都是很难去确定的,换句话说,这样的组合空间太大,人力无法穷举。基于上述背景,本项目使用的模型是EfficientNet,它使用一个简单而高效的复合系数来从depth, width, resolution 三个维度放大网络,不会像传统的方法那样任意缩放网络的维度,基于神经结构搜索技术可以获得最优的一组参数(复合系数)。从下图可看出,EfficientNet不仅比别的网络快很多,而且精度也更高。
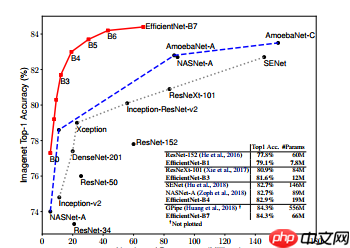
作者的实验研究表明了平衡深度、宽度和分辨率这三个维度是至关重要的,令人惊讶的是这样的平衡可以通过简单的使用一组常量比率来缩放每一个维度,基于这个观察,提出了一个简单高效的复合缩放方法,不像传统实践中任意缩放这些因子,我们的方法使用一组固定的缩放系数统一缩放网络深度、宽度和分辨率。
此图展示了传统的scale方法和本文提出的compound scaling 方法:
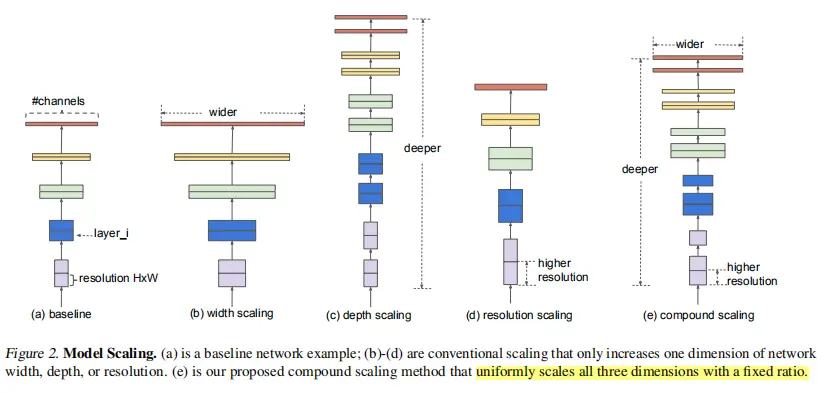
图a 传统的卷积神经网络
图b,在图a的基础上单独增加了网络的宽度(宽度代表的是特征层的channel)
图c,在图a的基础上单独增加了网络的深度,明显可以看到相对于图a,它的layers明显更多了,网络会变得更加深
图d,在图a基准网络的基础上对图像的分辨率进行了增加,提升图像的分辨率我们得到的每个特征矩阵高和宽会相应的增加
图e, 对网络同时增加网络的宽度、深度以及输入图像的分辨率
2.CBAM
CBAM( Convolutional Block Attention Module )是一种轻量级注意力模块的提出于2018年,它可以在空间维度和通道维度上进行Attention操作。论文在Resnet和MobileNet上加入CBAM模块进行对比,并针对两个注意力模块应用的先后进行实验,同时进行CAM可视化,可以看到Attention更关注目标物体。
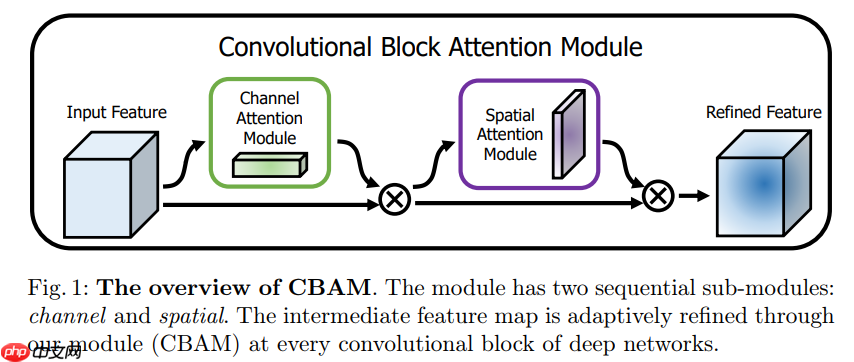
CBAM包含CAM(Channel Attention Module)和SAM(Spartial Attention Module)两个子模块,分别进行通道和空间上的Attention。这样不只能够节约参数和计算力,并且保证了其能够做为即插即用的模块集成到现有的网络架构中去。

通道注意力模块:通道维度不变,压缩空间维度。该模块关注输入图片中有意义的信息(分类任务就关注因为什么分成了不同类别)。
将输入的feature map经过两个并行的MaxPool层和AvgPool层,将特征图从C * H * W变为C * 1 * 1的大小,然后经过Share MLP模块,在该模块中,它先将通道数压缩为原来的1/r(Reduction,减少率)倍,再扩张到原通道数,经过ReLU激活函数得到两个激活后的结果。将这两个输出结果进行逐元素相加,再通过一个sigmoid激活函数得到Channel Attention的输出结果,再将这个输出结果乘原图,变回CHW的大小。
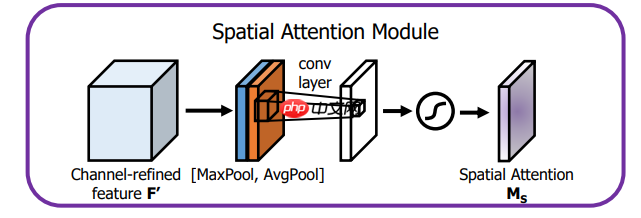
空间注意力模块:空间维度不变,压缩通道维度。该模块关注的是目标的位置信息。
将Channel Attention的输出结果通过最大池化和平均池化得到两个1 * H * W的特征图,然后经过Concat操作对两个特征图进行拼接,通过7 * 7卷积变为1通道的特征图(实验证明7 * 7效果比3 * 3好),再经过一个sigmoid得到Spatial Attention的特征图,最后将输出结果乘原图变回 C * H * W大小。
3. 模型改进
注意力机制不仅告诉我们Feature Map要关注什么,也提高了特征感兴趣特征的表现。目标是通过注意机制来增加重要的特征,抑制不必要的特征,该模块通过学习加强或抑制相关的特征信息,有效地帮助信息在网络传递。 为了更好的帮助Efficietnnet识别图像的特征矩阵,我将CBAM加入到Efficientent中,旨在增强重要特征防止经过深层卷积后造成特征丢失。
!pip install "paddlex<=2.0.0" -i https://mirror.baidu.com/pypi/simple
!pip install prettytable
import osfrom tqdm import tqdmfrom prettytable import PrettyTableimport matplotlib.pyplot as pltimport paddleimport paddleximport paddle.nn.functional as Fimport numpy as npimport cv2import jsonimport mathimport randomfrom PIL import Imagefrom paddle.io import Dataset # 导入Datasrt库from paddle.vision.transforms import Compose,Resize,Transpose,Normalize
对数据集进行解压到目标文件夹
if not os.path.exists("/home/aistudio/work/data"):
    ! unzip -oq data/data198683/Pests_dataset.zip -d work/data
class ConfusionMatrix(object):
    def __init__(self, num_classes: int, labels: list):
        self.matrix = np.zeros((num_classes, num_classes))
        self.num_classes = num_classes
        self.labels = labels    def update(self, preds, labels):
        for p, t in zip(preds, labels):
            self.matrix[p, t] += 1

    def summary(self):
        # calculate accuracy
        sum_TP = 0
        for i in range(self.num_classes):
            sum_TP += self.matrix[i, i]
        acc = sum_TP / np.sum(self.matrix)        print("the model accuracy is ", acc)        # precision, recall, specificity
        table = PrettyTable()
        table.field_names = ["", "Precision", "Recall", "Specificity"]        for i in range(self.num_classes):
            TP = self.matrix[i, i]
            FP = np.sum(self.matrix[i, :]) - TP
            FN = np.sum(self.matrix[:, i]) - TP
            TN = np.sum(self.matrix) - TP - FP - FN
            Precision = round(TP / (TP + FP), 3) if TP + FP != 0 else 0.
            Recall = round(TP / (TP + FN), 3) if TP + FN != 0 else 0.
            Specificity = round(TN / (TN + FP), 3) if TN + FP != 0 else 0.
            table.add_row([self.labels[i], Precision, Recall, Specificity])        print(table)    def plot(self):
        matrix = self.matrix        print(matrix)
        plt.imshow(matrix, cmap=plt.cm.Blues)        # 设置x轴坐标label
        plt.xticks(range(self.num_classes),range(self.num_classes), rotation=45)        # 设置y轴坐标label
        plt.yticks(range(self.num_classes), range(self.num_classes))        # 显示colorbar
        plt.colorbar()
        plt.xlabel('True Labels')
        plt.ylabel('Predicted Labels')
        plt.title('Confusion matrix')        # 在图中标注数量/概率信息
        thresh = matrix.max()        for x in range(self.num_classes):            for y in range(self.num_classes):                # 注意这里的matrix[y, x]不是matrix[x, y]
                info = int(matrix[y, x])
                plt.text(x, y, info,
                         verticalalignment='center',
                         horizontalalignment='center',
                         color="white" if info > thresh else "black")
        plt.tight_layout()
        plt.show()
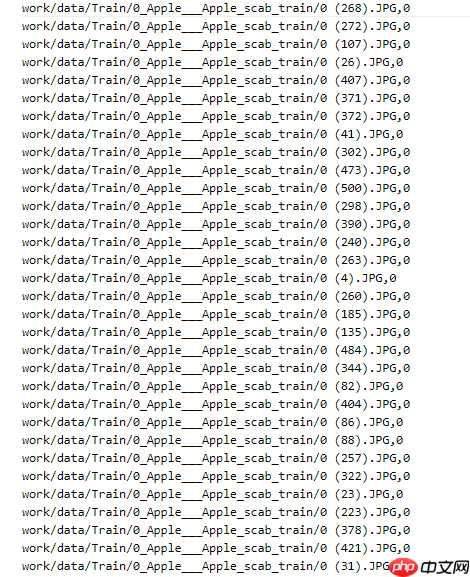
将数据集的标注写入txt文件以便于后来使用
train_list = os.listdir('work/data/Train')
train_list.sort()
class_flag = 0train_data = []
test_data = []for cls in train_list:
    num = len(os.path.join('work/data/Train', cls))    print(num)
    cls_path = os.path.join('work/data/Train', cls)
    data = [os.path.join('work/data/Train', cls, i, ','+ str(class_flag)) for i in os.listdir(cls_path)[int(0.8*num):]]    for i in data:
        train_data.append(i.split(','))
    class_flag += 1class_flag = 0for cls in train_list:
    num = len(os.path.join('work/data/Train', cls))
    cls_path = os.path.join('work/data/Train', cls)
    data = [os.path.join('work/data/Train', cls, i, ','+ str(class_flag)) for i in os.listdir(cls_path)[0:int(0.8*num)]]    for i in data:
        test_data.append(i.split(','))
    class_flag += 1with open('train.txt','w',encoding='UTF-8') as f:    for train_img in train_data:
            f.write(train_img[0][:-1] + ','+ train_img[1]+'\n')with open('test.txt','w',encoding='UTF-8') as f:    for test_img in test_data:
            f.write(test_img[0][:-1] + ','+ test_img[1]+'\n')with open('label.txt','w', encoding='UTF-8') as f:    for i in train_list:
        f.write(str(i)+'\n')print(train_list)
42
41
48
39
41
39
66
['0_Apple___Apple_scab_train', '1_Apple___Black_rot_train', '2_Apple___Cedar_apple_rust_train', '3_Apple___healthy_train', '4_Grape___Black_rot_train', '5_Grape___healthy_train', '6_Grape___Leaf_blight_(Isariopsis_Leaf_Spot)_train']
通过构建函数,将保存在txt中的图片路径读取出来并且将图片读取成矩阵的形式, label也转换为矩阵形式
from paddle.io import Dataset
os.environ["OPENCV_IO_ENABLE_OPENEXR"]="1"from paddle.vision import transforms as T


data_transforms = T.Compose([
    T.Resize((224, 224)),
    T.RandomHorizontalFlip(),
    T.ToTensor(),
    T.Normalize(mean=[0.5,0.5,0.5], std=[0.5,0.5,0.5])
])class MyDataset(Dataset):
    """
    步骤一:继承paddle.io.Dataset类
    """
    def __init__(self, mode='train'):
        """
        步骤二:实现构造函数,定义数据读取方式,划分训练和测试数据集
        """
        super(MyDataset, self).__init__()        if mode == 'train':
            self.data = train_data        else:
            self.data = test_data    def __getitem__(self, index):
        """
        步骤三:实现__getitem__方法,定义指定index时如何获取数据,并返回单条数据(训练数据,对应的标签)
        """
        data = self.data[index][0][:-1]
        label = self.data[index][1]
        image = cv2.imread(data)
        image = cv2.cvtColor(image, cv2.COLOR_BGR2RGB)
        image = data_transforms(image)        return image, paddle.to_tensor(int(label))    def __len__(self):
        """
        步骤四:实现__len__方法,返回数据集总数目
        """
        return len(self.data)

train_loader = paddle.io.DataLoader(MyDataset("train"), batch_size=16, shuffle=True, use_buffer_reader =True)
test_loader =  paddle.io.DataLoader(MyDataset("test"), batch_size=16, shuffle=True, use_buffer_reader =True)
三、模型训练
从net文件夹中导入EfficientNet和EfficientNet_CBAM模块,并且开始训练,将训练好的模型保存起来
from net import EfficientNetfrom net import EfficientNet_CBAM
paddle.disable_static()
epoch_num = 20batch_size = 16learning_rate = 0.005loss_value = []def train(model):
    print('start training ... ')    # turn into training mode
    model.train()

    opt = paddle.optimizer.Adam(learning_rate=learning_rate,
                                parameters=model.parameters())    for epoch in range(epoch_num):
        acc_train = []        for batch_id, data in enumerate(train_loader):
            x_data = data[0]
            y_data = paddle.to_tensor(data[1])            # y_data = paddle.unsqueeze(y_data, 1)
            logits = model(x_data)
            loss = F.cross_entropy(logits, y_data)
            acc = paddle.metric.accuracy(logits, y_data)
            acc_train.append(acc.numpy())            if batch_id % 100 == 0:                print("epoch: {}, batch_id: {}, loss is: {}".format(epoch, batch_id, loss.numpy()))
                avg_acc = np.mean(acc_train)                print("[train] accuracy: {}".format(avg_acc))
                loss_value.append(loss.numpy())
            loss.backward()
            opt.step()
            opt.clear_grad()
model = EfficientNet.from_name('efficientnet-b0')# print(paddle.flops(model,input_size=[1,3,224,224],print_detail=True))train(model)
x1 = len(loss_value)
y1 = loss_value
paddle.save(model.state_dict(), "model.pdparams")
loss_value = []
model = EfficientNet_CBAM.from_name('efficientnet-b0')# print(paddle.flops(model,input_size=[1,3,224,224],print_detail=True))train(model)
x2 = len(loss_value)
y2 = loss_value
paddle.save(model.state_dict(), "model_CBAM.pdparams")
plt.plot(range(x1), y1, label ='EfficientNet')
plt.plot(range(x2), y2, label ='EfficientNet_CBAM')
plt.ylabel('loss_value')
plt.xlabel('batch_size')
plt.title('loss')
plt.legend()
plt.show()
/opt/conda/envs/python35-paddle120-env/lib/python3.7/site-packages/matplotlib/cbook/__init__.py:2349: DeprecationWarning: Using or importing the ABCs from 'collections' instead of from 'collections.abc' is deprecated, and in 3.8 it will stop working
  if isinstance(obj, collections.Iterator):
/opt/conda/envs/python35-paddle120-env/lib/python3.7/site-packages/matplotlib/cbook/__init__.py:2366: DeprecationWarning: Using or importing the ABCs from 'collections' instead of from 'collections.abc' is deprecated, and in 3.8 it will stop working
  return list(data) if isinstance(data, collections.MappingView) else data
model.eval()
model.load_dict(paddle.load('model.pdparams'))


confusion = ConfusionMatrix(num_classes=7, labels=train_list)with paddle.no_grad():    for batch_id, data in enumerate(test_loader):
        x_data = data[0]
        y_data = paddle.to_tensor(data[1])
        outputs = model(x_data)
        outputs = paddle.nn.functional.softmax(outputs, axis=1)
        outputs = np.argmax(outputs, axis=1)
        confusion.update(outputs, data[1].numpy())
    confusion.plot()
    confusion.summary()


model.load_dict(paddle.load('model_CBAM.pdparams'))with paddle.no_grad():    for batch_id, data in enumerate(test_loader):
        x_data = data[0]
        y_data = paddle.to_tensor(data[1])
        outputs = model(x_data)
        outputs = paddle.nn.functional.softmax(outputs, axis=1)
        outputs = np.argmax(outputs, axis=1)
        confusion.update(outputs, data[1].numpy())
    confusion.plot()
    confusion.summary()
/opt/conda/envs/python35-paddle120-env/lib/python3.7/site-packages/paddle/fluid/dygraph/layers.py:1517: UserWarning: Skip loading for ca.fc1.weight. ca.fc1.weight is not found in the provided dict.
  warnings.warn(("Skip loading for {}. ".format(key) + str(err)))
/opt/conda/envs/python35-paddle120-env/lib/python3.7/site-packages/paddle/fluid/dygraph/layers.py:1517: UserWarning: Skip loading for ca.fc1.bias. ca.fc1.bias is not found in the provided dict.
  warnings.warn(("Skip loading for {}. ".format(key) + str(err)))
/opt/conda/envs/python35-paddle120-env/lib/python3.7/site-packages/paddle/fluid/dygraph/layers.py:1517: UserWarning: Skip loading for ca.fc2.weight. ca.fc2.weight is not found in the provided dict.
  warnings.warn(("Skip loading for {}. ".format(key) + str(err)))
/opt/conda/envs/python35-paddle120-env/lib/python3.7/site-packages/paddle/fluid/dygraph/layers.py:1517: UserWarning: Skip loading for ca.fc2.bias. ca.fc2.bias is not found in the provided dict.
  warnings.warn(("Skip loading for {}. ".format(key) + str(err)))
/opt/conda/envs/python35-paddle120-env/lib/python3.7/site-packages/paddle/fluid/dygraph/layers.py:1517: UserWarning: Skip loading for sa.conv1.weight. sa.conv1.weight is not found in the provided dict.
  warnings.warn(("Skip loading for {}. ".format(key) + str(err)))
/opt/conda/envs/python35-paddle120-env/lib/python3.7/site-packages/paddle/fluid/dygraph/layers.py:1517: UserWarning: Skip loading for sa.conv1.bias. sa.conv1.bias is not found in the provided dict.
  warnings.warn(("Skip loading for {}. ".format(key) + str(err)))
[[33.  0.  0.  1.  0.  0.  0.]
 [ 0. 31.  0.  0.  0.  0.  0.]
 [ 0.  0. 38.  0.  0.  0.  1.]
 [ 0.  0.  0. 30.  0.  0.  0.]
 [ 0.  1.  0.  0. 32.  0. 14.]
 [ 0.  0.  0.  0.  0. 31.  0.]
 [ 0.  0.  0.  0.  0.  0. 37.]]
/opt/conda/envs/python35-paddle120-env/lib/python3.7/site-packages/matplotlib/image.py:425: DeprecationWarning: np.asscalar(a) is deprecated since NumPy v1.16, use a.item() instead
  a_min = np.asscalar(a_min.astype(scaled_dtype))
/opt/conda/envs/python35-paddle120-env/lib/python3.7/site-packages/matplotlib/image.py:426: DeprecationWarning: np.asscalar(a) is deprecated since NumPy v1.16, use a.item() instead
  a_max = np.asscalar(a_max.astype(scaled_dtype))
the model accuracy is  0.9317269076305221
+----------------------------------------------------+-----------+--------+-------------+
|                                                    | Precision | Recall | Specificity |
+----------------------------------------------------+-----------+--------+-------------+
|             0_Apple___Apple_scab_train             |   0.971   |  1.0   |    0.995    |
|             1_Apple___Black_rot_train              |    1.0    | 0.969  |     1.0     |
|          2_Apple___Cedar_apple_rust_train          |   0.974   |  1.0   |    0.995    |
|              3_Apple___healthy_train               |    1.0    | 0.968  |     1.0     |
|             4_Grape___Black_rot_train              |   0.681   |  1.0   |    0.931    |
|              5_Grape___healthy_train               |    1.0    |  1.0   |     1.0     |
| 6_Grape___Leaf_blight_(Isariopsis_Leaf_Spot)_train |    1.0    | 0.712  |     1.0     |
+----------------------------------------------------+-----------+--------+-------------+
[[65.  0.  0.  1.  0.  0.  0.]
 [ 0. 63.  0.  0.  0.  0.  0.]
 [ 0.  0. 76.  0.  0.  0.  1.]
 [ 1.  0.  0. 61.  0.  3.  0.]
 [ 0.  1.  0.  0. 63.  0. 14.]
 [ 0.  0.  0.  0.  0. 59.  0.]
 [ 0.  0.  0.  0.  1.  0. 89.]]
the model accuracy is  0.9558232931726908
+----------------------------------------------------+-----------+--------+-------------+
|                                                    | Precision | Recall | Specificity |
+----------------------------------------------------+-----------+--------+-------------+
|             0_Apple___Apple_scab_train             |   0.985   | 0.985  |    0.998    |
|             1_Apple___Black_rot_train              |    1.0    | 0.984  |     1.0     |
|          2_Apple___Cedar_apple_rust_train          |   0.987   |  1.0   |    0.998    |
|              3_Apple___healthy_train               |   0.938   | 0.984  |    0.991    |
|             4_Grape___Black_rot_train              |   0.808   | 0.984  |    0.965    |
|              5_Grape___healthy_train               |    1.0    | 0.952  |     1.0     |
| 6_Grape___Leaf_blight_(Isariopsis_Leaf_Spot)_train |   0.989   | 0.856  |    0.997    |
+----------------------------------------------------+-----------+--------+-------------+
四、模型预测
使用保存好的模型用来预测单个图片,因为测试集没有标注,所以我这里使用训练集中的图片进行预测
im = Image.open('work/data/Train/2_Apple___Cedar_apple_rust_train/2 (104).JPG')
plt.imshow(im)
im = data_transforms(im)
im = paddle.unsqueeze(im, axis=0)with paddle.no_grad(): #不求损失梯度,而网络默认会求损失梯度
    outputs = model(im)
    pre =paddle.nn.functional.softmax(outputs, axis=1)[0],#再次也可用softmax替代max来进行分类。print(train_list[int(np.argmax(pre[0]))])#把索引index 传给classes,得到分类
2_Apple___Cedar_apple_rust_train
五、总结
通过这次项目我学到了如何使用自己的模型对数据进行训练,并且对数据进行了一系列处理和可视化,让结果看起来更加明显易懂,通过使用Efficientnet网络模型我成功实现对几种植物病虫害的分类,又通过上网查找找到了CBAM轻量化注意力模块,虽然我将CBAM放入Efficientnet中了,但是造成计算量和参数量大大提升,下一步的目标是看看可以从哪些方面改进模型,争取实现更高精度的同时可以将计算量和参数量降下来。


