SPGNet是一种基于串行和并行组块的新型卷积神经网络。其深入研究分组卷积,分为串行、并行和串并行三种类型,能捕获多尺度信息且结构紧凑。在图像分类等任务中表现优异,与最先进网络性能相当,在NPU上,类似FLOPs下比MobileNetV2快120%,类似精度下比GhostNetkuai300%以上。
☞☞☞AI 智能聊天, 问答助手, AI 智能搜索, 免费无限量使用 DeepSeek R1 模型☜☜☜

神经网络处理单元 (NPU) 专门用于深度神经网络 (DNN) 的加速,对于机器人或边缘计算等延迟敏感领域具有重要意义。然而,最近的研究很少有关注 NPU 网络设计的工作。大多数流行的轻量级结构(例如MobileNet)都是采用深度卷积设计的,理论上计算量较少,但对现有硬件并不友好,并且在NPU上测试的速度并不总是令人满意。即使在相似的 FLOP(乘法累加次数)下,普通卷积运算也总是比深度卷积运算快。在本文中,我们将提出一种名为串行并行组网络(SPGNet)的新颖架构,它可以捕获有区别的多尺度信息,同时保持结构紧凑。对不同的计算机视觉任务进行了广泛的评估,例如图像分类(CIFAR 和 ImageNet)、对象检测(PASCAL VOC 和 MS COCO)和人员重新识别(Market-1501 和 DukeMTMC-ReID)。实验结果表明,我们提出的 SPGNet 可以实现与最先进网络相当的性能,同时在类似 FLOPs 下速度比 MobileNetV2 快 120%,在 NPU 上具有类似精度的情况下比 GhostNet 快 300% 以上。
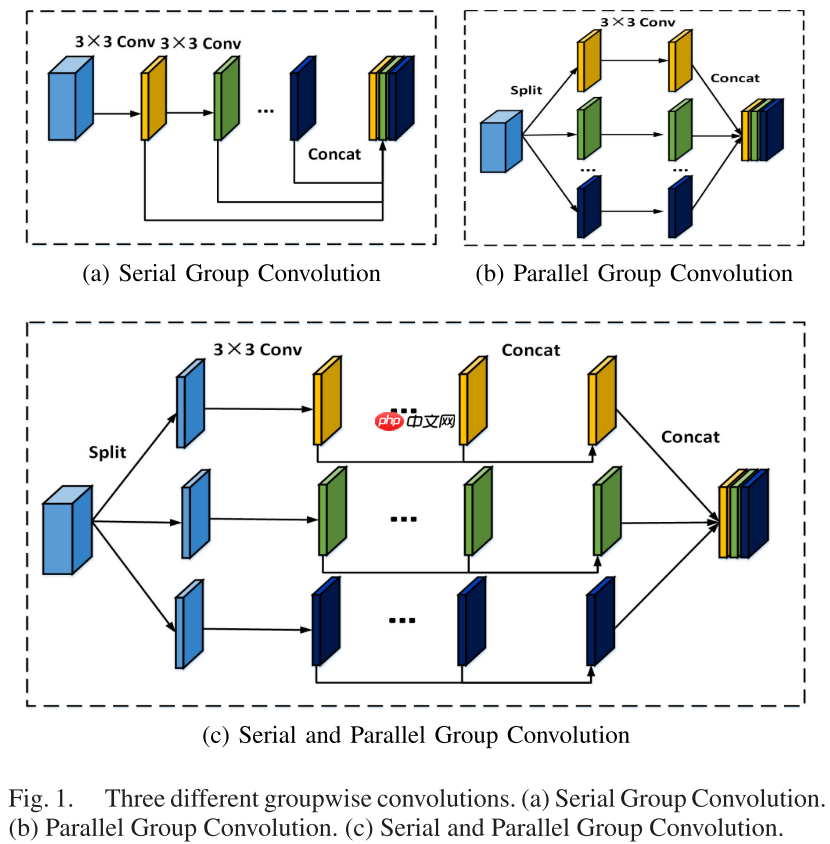
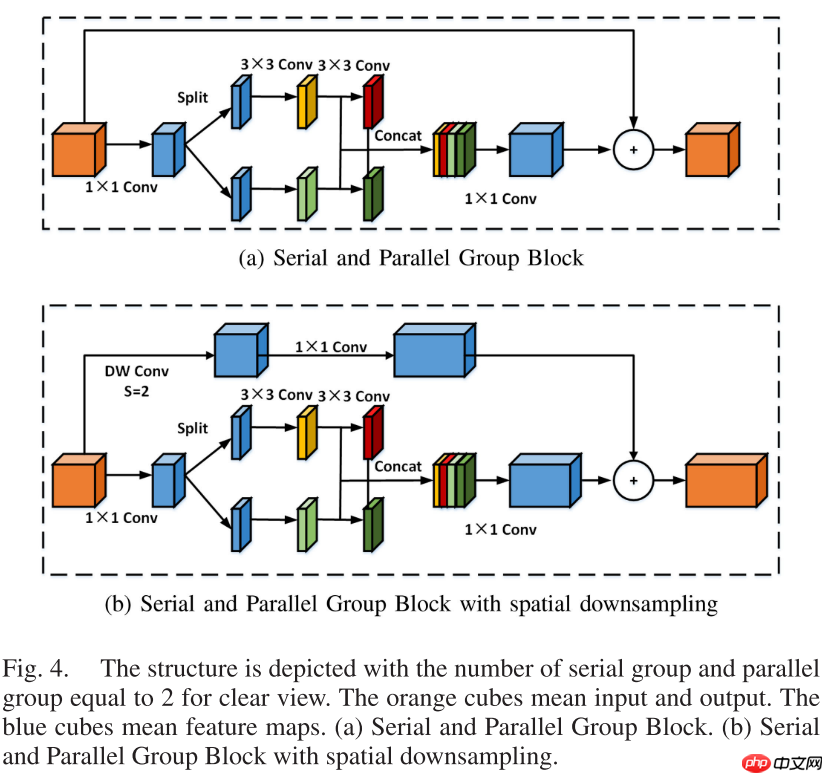
本文深入研究了分组卷积,并将其分为三种类型:串行组卷积、并行组卷积核串并行组卷积。
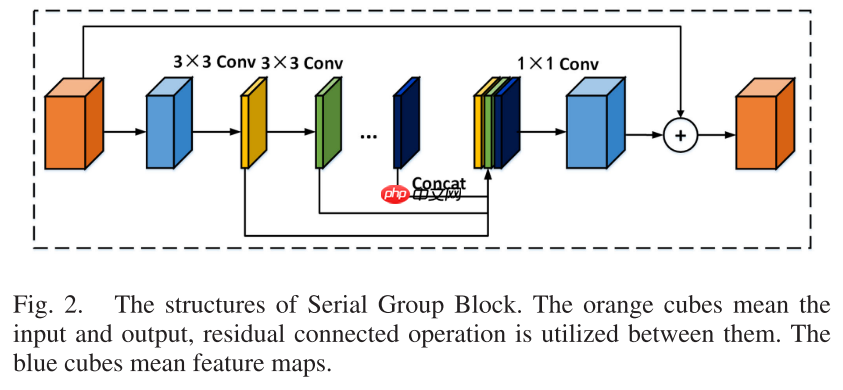
先使用1 * 1卷积将通道缩减为原来的一半,然后使用连续的3 * 3卷积,并将其合并,最后使用1 * 1卷积恢复原来的通道数。
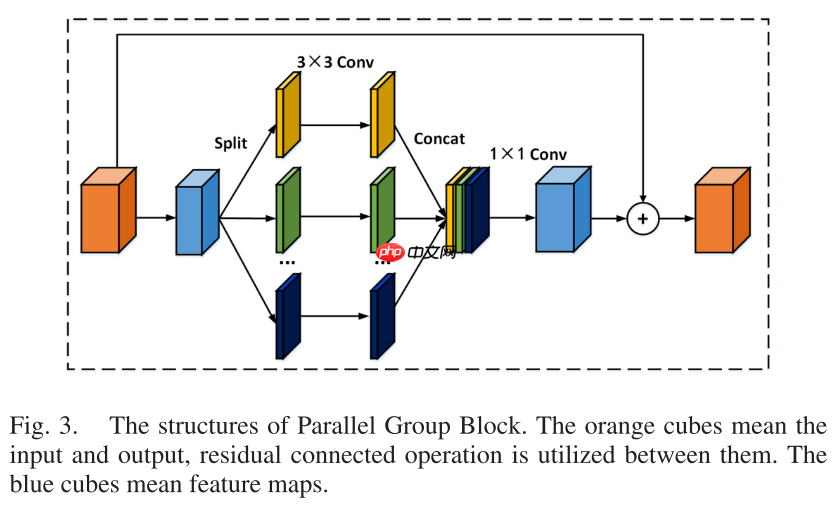
通过1 * 1卷积将通道数缩减到原来的一半,然后将其沿通道分成P组,分别对每组使用3 * 3 卷积,最后将输出合并,并使用1 * 1卷积恢复之前的通道数。
1、企业信息:发布介绍企业的各类信息,如企业简介、组织机构、营销网络、企业荣誉、联系方式,并可随意增加新的栏目等。 2、新闻动态:发布企业新闻和业内资讯,无限级分类,大增加信息发布的灵活性。 3、产品展示:发布企业产品,按产品类别显示及搜索产品,浏览者可根据自己的习惯和需要自主设置产品显示样式,并可直接 下订单,无限级分类,大增加信息发布的灵活性。 4、需求信息:发布企业的求购信息,可以进行分
 0
0

将串行组卷积与并行组卷积结合起来,先分组,再在每组中使用串行组卷积。
%matplotlib inlineimport paddleimport numpy as npimport matplotlib.pyplot as pltfrom paddle.vision.datasets import Cifar10from paddle.vision.transforms import Transposefrom paddle.io import Dataset, DataLoaderfrom paddle import nnimport paddle.nn.functional as Fimport paddle.vision.transforms as transformsimport osimport matplotlib.pyplot as pltfrom matplotlib.pyplot import figurefrom models import *
train_tfm = transforms.Compose([
    transforms.RandomCrop(32, padding=4),
    transforms.RandomHorizontalFlip(0.5),
    transforms.ToTensor(),
    transforms.Normalize(mean=(0.485, 0.456, 0.406), std=(0.229, 0.224, 0.225)),
])

test_tfm = transforms.Compose([
    transforms.Resize((32, 32)),
    transforms.ToTensor(),
    transforms.Normalize(mean=(0.485, 0.456, 0.406), std=(0.229, 0.224, 0.225)),
])paddle.vision.set_image_backend('cv2')# 使用Cifar10数据集train_dataset = Cifar10(data_file='data/data152754/cifar-10-python.tar.gz', mode='train', transform = train_tfm, )
val_dataset = Cifar10(data_file='data/data152754/cifar-10-python.tar.gz', mode='test',transform = test_tfm)print("train_dataset: %d" % len(train_dataset))print("val_dataset: %d" % len(val_dataset))train_dataset: 50000 val_dataset: 10000
batch_size=256
train_loader = DataLoader(train_dataset, batch_size=batch_size, shuffle=True, drop_last=True, num_workers=4)
val_loader = DataLoader(val_dataset, batch_size=batch_size, shuffle=False, drop_last=False, num_workers=4)
class LabelSmoothingCrossEntropy(nn.Layer):
    def __init__(self, smoothing=0.1):
        super().__init__()
        self.smoothing = smoothing    def forward(self, pred, target):

        confidence = 1. - self.smoothing
        log_probs = F.log_softmax(pred, axis=-1)
        idx = paddle.stack([paddle.arange(log_probs.shape[0]), target], axis=1)
        nll_loss = paddle.gather_nd(-log_probs, index=idx)
        smooth_loss = paddle.mean(-log_probs, axis=-1)
loss = confidence * nll_loss + self.smoothing * smooth_loss return loss.mean()model = SPGNet(num_classes=10) paddle.summary(model, (1, 3, 32, 32))

learning_rate = 0.1n_epochs = 200paddle.seed(42)
np.random.seed(42)
work_path = 'work/model'# SPGNet-S2P6model = SPGNet(num_classes=10)

criterion = LabelSmoothingCrossEntropy()

scheduler = paddle.optimizer.lr.CosineAnnealingDecay(learning_rate=learning_rate, T_max=50000 // batch_size * n_epochs, verbose=False)
optimizer = paddle.optimizer.Momentum(parameters=model.parameters(), learning_rate=scheduler, weight_decay=5e-4)

gate = 0.0threshold = 0.0best_acc = 0.0val_acc = 0.0loss_record = {'train': {'loss': [], 'iter': []}, 'val': {'loss': [], 'iter': []}}   # for recording lossacc_record = {'train': {'acc': [], 'iter': []}, 'val': {'acc': [], 'iter': []}}      # for recording accuracyloss_iter = 0acc_iter = 0for epoch in range(n_epochs):    # ---------- Training ----------
    model.train()
    train_num = 0.0
    train_loss = 0.0

    val_num = 0.0
    val_loss = 0.0
    accuracy_manager = paddle.metric.Accuracy()
    val_accuracy_manager = paddle.metric.Accuracy()    print("#===epoch: {}, lr={:.10f}===#".format(epoch, optimizer.get_lr()))    for batch_id, data in enumerate(train_loader):
        x_data, y_data = data
        labels = paddle.unsqueeze(y_data, axis=1)

        logits = model(x_data)

        loss = criterion(logits, y_data)

        acc = accuracy_manager.compute(logits, labels)
        accuracy_manager.update(acc)        if batch_id % 10 == 0:
            loss_record['train']['loss'].append(loss.numpy())
            loss_record['train']['iter'].append(loss_iter)
            loss_iter += 1

        loss.backward()

        optimizer.step()
        scheduler.step()
        optimizer.clear_grad()

        train_loss += loss
        train_num += len(y_data)

    total_train_loss = (train_loss / train_num) * batch_size
    train_acc = accuracy_manager.accumulate()
    acc_record['train']['acc'].append(train_acc)
    acc_record['train']['iter'].append(acc_iter)
    acc_iter += 1
    # Print the information.
    print("#===epoch: {}, train loss is: {}, train acc is: {:2.2f}%===#".format(epoch, total_train_loss.numpy(), train_acc*100))    # ---------- Validation ----------
    model.eval()    for batch_id, data in enumerate(val_loader):

        x_data, y_data = data
        labels = paddle.unsqueeze(y_data, axis=1)        with paddle.no_grad():
          logits = model(x_data)

        loss = criterion(logits, y_data)

        acc = val_accuracy_manager.compute(logits, labels)
        val_accuracy_manager.update(acc)

        val_loss += loss
        val_num += len(y_data)

    total_val_loss = (val_loss / val_num) * batch_size
    loss_record['val']['loss'].append(total_val_loss.numpy())
    loss_record['val']['iter'].append(loss_iter)
    val_acc = val_accuracy_manager.accumulate()
    acc_record['val']['acc'].append(val_acc)
    acc_record['val']['iter'].append(acc_iter)
    print("#===epoch: {}, val loss is: {}, val acc is: {:2.2f}%===#".format(epoch, total_val_loss.numpy(), val_acc*100))    # ===================save====================
    if val_acc > best_acc:
        best_acc = val_acc
        paddle.save(model.state_dict(), os.path.join(work_path, 'best_model.pdparams'))
        paddle.save(optimizer.state_dict(), os.path.join(work_path, 'best_optimizer.pdopt'))print(best_acc)
paddle.save(model.state_dict(), os.path.join(work_path, 'final_model.pdparams'))
paddle.save(optimizer.state_dict(), os.path.join(work_path, 'final_optimizer.pdopt'))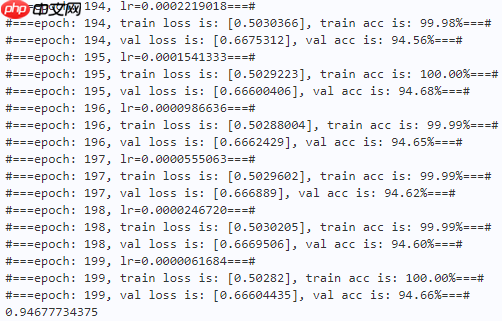
def plot_learning_curve(record, title='loss', ylabel='CE Loss'):
    ''' Plot learning curve of your CNN '''
    maxtrain = max(map(float, record['train'][title]))
    maxval = max(map(float, record['val'][title]))
    ymax = max(maxtrain, maxval) * 1.1
    mintrain = min(map(float, record['train'][title]))
    minval = min(map(float, record['val'][title]))
    ymin = min(mintrain, minval) * 0.9

    total_steps = len(record['train'][title])
    x_1 = list(map(int, record['train']['iter']))
    x_2 = list(map(int, record['val']['iter']))
    figure(figsize=(10, 6))
    plt.plot(x_1, record['train'][title], c='tab:red', label='train')
    plt.plot(x_2, record['val'][title], c='tab:cyan', label='val')
    plt.ylim(ymin, ymax)
    plt.xlabel('Training steps')
    plt.ylabel(ylabel)
    plt.title('Learning curve of {}'.format(title))
    plt.legend()
plt.show()plot_learning_curve(loss_record, title='loss', ylabel='CE Loss')
/opt/conda/envs/python35-paddle120-env/lib/python3.7/site-packages/matplotlib/cbook/__init__.py:2349: DeprecationWarning: Using or importing the ABCs from 'collections' instead of from 'collections.abc' is deprecated, and in 3.8 it will stop working
  if isinstance(obj, collections.Iterator):
/opt/conda/envs/python35-paddle120-env/lib/python3.7/site-packages/matplotlib/cbook/__init__.py:2366: DeprecationWarning: Using or importing the ABCs from 'collections' instead of from 'collections.abc' is deprecated, and in 3.8 it will stop working
  return list(data) if isinstance(data, collections.MappingView) else data
<Figure size 1000x600 with 1 Axes>
plot_learning_curve(acc_record, title='acc', ylabel='Accuracy')
<Figure size 1000x600 with 1 Axes>
import time
work_path = 'work/model'model = SPGNet(num_classes=10)
model_state_dict = paddle.load(os.path.join(work_path, 'best_model.pdparams'))
model.set_state_dict(model_state_dict)
model.eval()
aa = time.time()for batch_id, data in enumerate(val_loader):

    x_data, y_data = data
    labels = paddle.unsqueeze(y_data, axis=1)    with paddle.no_grad():
        logits = model(x_data)
bb = time.time()print("Throughout:{}".format(int(len(val_dataset)//(bb - aa))))Throughout:3317
def get_cifar10_labels(labels):
    """返回CIFAR10数据集的文本标签。"""
text_labels = [ 'airplane', 'automobile', 'bird', 'cat', 'deer', 'dog', 'frog', 'horse', 'ship', 'truck'] return [text_labels[int(i)] for i in labels]def show_images(imgs, num_rows, num_cols, pred=None, gt=None, scale=1.5):
"""Plot a list of images."""
figsize = (num_cols * scale, num_rows * scale)
_, axes = plt.subplots(num_rows, num_cols, figsize=figsize)
axes = axes.flatten() for i, (ax, img) in enumerate(zip(axes, imgs)): if paddle.is_tensor(img):
ax.imshow(img.numpy()) else:
ax.imshow(img)
ax.axes.get_xaxis().set_visible(False)
ax.axes.get_yaxis().set_visible(False) if pred or gt:
ax.set_title("pt: " + pred[i] + "\ngt: " + gt[i]) return axeswork_path = 'work/model'X, y = next(iter(DataLoader(val_dataset, batch_size=18))) model = SPGNet(num_classes=10) model_state_dict = paddle.load(os.path.join(work_path, 'best_model.pdparams')) model.set_state_dict(model_state_dict) model.eval() logits = model(X) y_pred = paddle.argmax(logits, -1) X = paddle.transpose(X, [0, 2, 3, 1]) axes = show_images(X.reshape((18, 32, 32, 3)), 1, 18, pred=get_cifar10_labels(y_pred), gt=get_cifar10_labels(y)) plt.show()
Clipping input data to the valid range for imshow with RGB data ([0..1] for floats or [0..255] for integers).
Clipping input data to the valid range for imshow with RGB data ([0..1] for floats or [0..255] for integers).
Clipping input data to the valid range for imshow with RGB data ([0..1] for floats or [0..255] for integers).
Clipping input data to the valid range for imshow with RGB data ([0..1] for floats or [0..255] for integers).
Clipping input data to the valid range for imshow with RGB data ([0..1] for floats or [0..255] for integers).
Clipping input data to the valid range for imshow with RGB data ([0..1] for floats or [0..255] for integers).
Clipping input data to the valid range for imshow with RGB data ([0..1] for floats or [0..255] for integers).
Clipping input data to the valid range for imshow with RGB data ([0..1] for floats or [0..255] for integers).
Clipping input data to the valid range for imshow with RGB data ([0..1] for floats or [0..255] for integers).
Clipping input data to the valid range for imshow with RGB data ([0..1] for floats or [0..255] for integers).
Clipping input data to the valid range for imshow with RGB data ([0..1] for floats or [0..255] for integers).
Clipping input data to the valid range for imshow with RGB data ([0..1] for floats or [0..255] for integers).
Clipping input data to the valid range for imshow with RGB data ([0..1] for floats or [0..255] for integers).
Clipping input data to the valid range for imshow with RGB data ([0..1] for floats or [0..255] for integers).
Clipping input data to the valid range for imshow with RGB data ([0..1] for floats or [0..255] for integers).
Clipping input data to the valid range for imshow with RGB data ([0..1] for floats or [0..255] for integers).
Clipping input data to the valid range for imshow with RGB data ([0..1] for floats or [0..255] for integers).
Clipping input data to the valid range for imshow with RGB data ([0..1] for floats or [0..255] for integers).
<Figure size 2700x150 with 18 Axes>
本文提出了一种基于串行和并行组块的新型卷积神经网络—— SPGNet。它享有多尺度信息和分组卷积的优点,轻量且准确。
以上就是【TMM 2022】SPGNet:串行和并行组网络的详细内容,更多请关注php中文网其它相关文章!

每个人都需要一台速度更快、更稳定的 PC。随着时间的推移,垃圾文件、旧注册表数据和不必要的后台进程会占用资源并降低性能。幸运的是,许多工具可以让 Windows 保持平稳运行。

Copyright 2014-2025 https://www.php.cn/ All Rights Reserved | php.cn | 湘ICP备2023035733号